Actual growth raises current real output; potential growth raises sustainable productive capacity.
Must know
- Investment and productivity can expand capacity.
- Output gaps compare actual with potential output.
- Growth brings both material benefits and possible costs.
Must know definitions
Actual growth: an increase in real GDP. It can result from stronger aggregate demand when there is spare capacity, or from improved supply conditions.
Potential growth: an increase in the economy’s productive capacity, represented by an outward PPF shift or a rightward LRAS shift.
Export-led growth: real GDP growth driven by expanding exports and the production that supports them.
Output gap: actual real GDP minus potential real GDP, often expressed as a percentage of potential real GDP.
Negative output gap: actual output is below potential output; spare capacity exists.
Positive output gap: actual output is above potential output; resources are used beyond normal capacity.
Technical recession: two consecutive quarters of falling real GDP. Broader definitions also assess the depth and spread of declining economic activity.
Must know relationship: Output gap (%) = (actual output − potential output) / potential output × 100.
Interpretation: a positive result means output exceeds estimated potential; a negative result means spare capacity. Use real output measured on a comparable basis. Potential output is estimated, so the measured gap is uncertain.
Explain and apply
Mechanism in brief: Higher AD can employ idle resources and raise actual output. Investment, skills and technology can separately increase capacity; sustained growth requires productive potential to keep pace with demand.
Distinguish: An output gap concerns levels of output, not the difference between growth rates; higher GDP need not benefit everyone equally.
Use the extract: Compare actual output with capacity; distinguish stronger demand from new resources or higher productivity.
Actual and potential growth
- Actual growth means real GDP rises. Higher AD can raise real output when resources are underused; an increase in aggregate supply can also raise actual output.
- Potential growth means productive capacity rises through more or better resources or technology. Capacity can increase even if weak demand leaves it partly unused.
Demand-led recovery: consumption, investment, government spending or net exports rise → AD shifts right → firms increase output using spare capacity. Potential growth: investment, skills or technology improve productive capacity → LRAS shifts right. The first process does not automatically cause the second.
- The size of actual growth generated by an AD increase depends on two things: the size of the multiplier, and the shape of the AS curve.
- Where SRAS/LRAS is closer to vertical (less spare capacity), more of the AD increase is absorbed into higher prices rather than higher real output.
Actual growth concerns output produced; potential growth concerns capacity. Moving towards the existing PPF raises actual output, while shifting the PPF outward raises potential output. Actual output can also rise after a supply improvement.
Figure 2.22 Actual and potential output
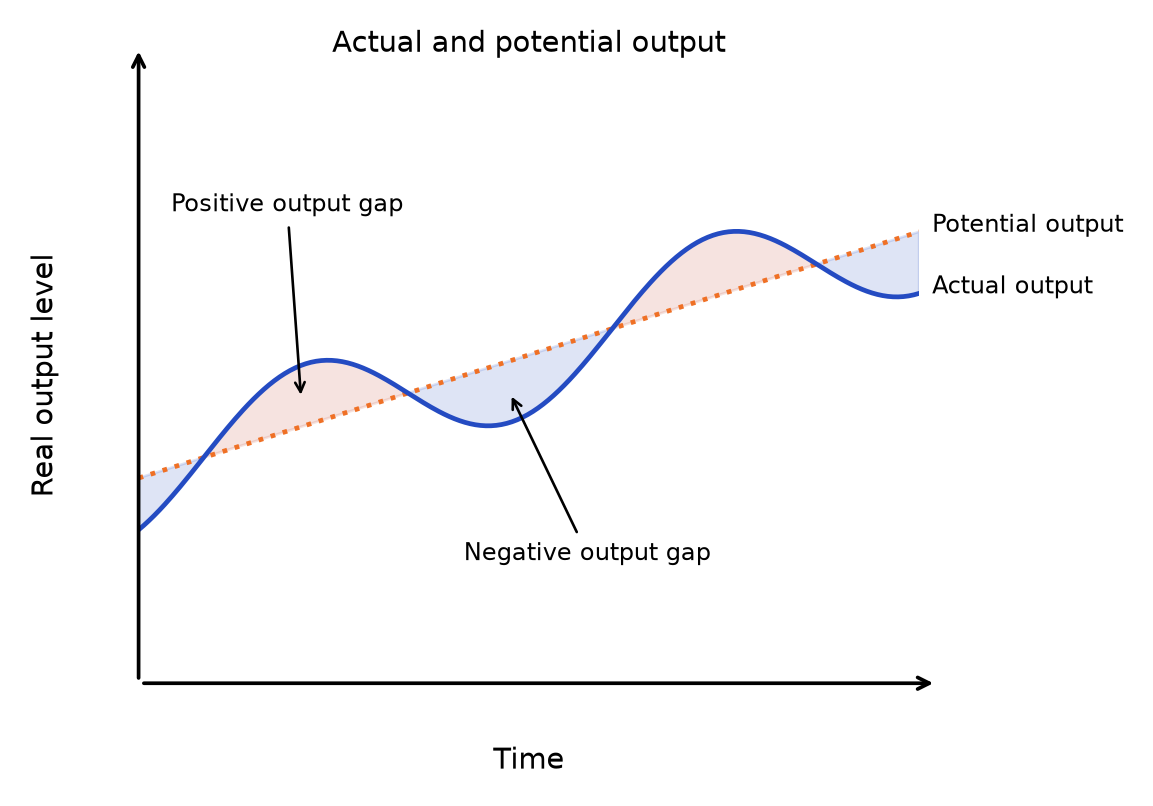
Read the diagram: The vertical distance compares actual and potential output levels at the same time. Above potential is a positive gap; below is a negative gap. These are not gaps between the two growth rates.
Causes of growth
| Cause | Type of growth | Mechanism |
|---|---|---|
| ↑ Components of AD (C, I, G, net exports) | Actual growth | Direct rightward shift of AD, amplified by the multiplier |
| ↑ Quantity/quality of labour force (incl. net migration, education) | Potential growth | Larger, more productive workforce → LRAS shifts right |
| ↑ Investment / capital deepening (↑ size of physical capital stock per worker) | Potential growth | More/better capital → higher output per worker → LRAS shifts right |
| Improved technology | Potential growth | More efficient production → LRAS shifts right |
| Innovation (product, process, or behavioural) | Potential growth | New goods, better production methods, or better organisational practices → productivity ↑ → LRAS shifts right |
| ↑ Degree of competition | Potential growth | Spurs firms to become more efficient → productivity ↑ |
| ↑ Productivity of any factor of production | Potential growth | Same inputs produce more output → LRAS shifts right |
Export-led growth
- Export-led growth occurs when expanding exports support higher domestic production. A rise in export value caused only by higher prices does not establish real output growth.
- China is the classic example, having achieved rapid growth through huge export expansion into global markets.
→ Exports (X) ↑ → direct injection into the circular flow → AD ↑ → multiplier effect amplifies the increase → real GDP ↑
- Export-led growth also brings in foreign currency, which can fund imports of capital goods, raising productive capacity (LRAS) and supporting more sustainable long-run growth.
The risk is dependence on external demand
if trading partners fall into recession, exports fall, dragging down AD and risking a domestic downturn.
Benefits of growth
| Benefit | Explanation |
|---|---|
| Higher living standards | Average incomes rise, giving households access to more goods and services and a higher quality of consumption |
| Increased employment | Firms expand output and hire more workers, helping to reduce unemployment |
| Higher revenues and profits for firms | Rising sales and profits encourage further investment, funding new technology and capacity |
| Increased confidence | Rising consumer and business confidence supports further consumption and investment, reinforcing the expansion |
| Higher tax revenues | A larger tax base and higher incomes improve the government's budget balance, funding public services such as health and education |
Costs of growth
| Cost | Explanation |
|---|---|
| Opportunity cost | Producing more capital goods today requires sacrificing some current consumer goods, ceteris paribus |
| Environmental damage | Growth generates negative externalities (e.g. pollution) and depletes non-renewable resources |
| Worsening trade balance | Rising incomes raise import spending, while higher domestic inflation can reduce export competitiveness |
| Rising inequality | If owners of capital benefit disproportionately more than workers or non-owners, relative poverty and income inequality can widen |
| Macroeconomic instability | Growth driven mainly by demand can generate demand-pull inflation, especially where the AS curve is inelastic, alongside shoe-leather and menu costs for consumers and firms |
- A useful exam technique for growth costs and benefits is to consider the impact on different groups — consumers, firms, the government, and future generations — since growth is rarely a uniform gain: some groups face real costs even as average incomes rise.
Output gaps
- The output gap compares output levels at the same date, not growth rates. If actual output grows faster than potential output, a negative gap may narrow; it need not immediately become positive.
Negative output gap
actual real GDP < potential real GDP → spare capacity exists in the economy → resources (labour and capital) are underemployed → downward pressure on inflation.
Positive output gap
actual real GDP > potential real GDP → resources are used beyond their normal sustainable capacity (e.g. overtime working) → upward pressure on inflation.
Diagram link: Actual and potential output earlier in this topic. Apply the same labels and assumptions to the change described here.
| Negative output gap | Positive output gap | |
|---|---|---|
| Definition | Actual output < potential output | Actual output > potential output |
| Capacity | Spare capacity, resources underused | Over-capacity, resources overused |
| Inflation pressure | Downward | Upward |
| Associated with | Can accompany deficient demand; recession and a negative gap are distinct. | Demand above sustainable capacity; rapid growth alone does not prove a positive gap. |
Illustrating output gaps on an AD/AS diagram requires distinguishing the Keynesian and classical views of LRAS:
Keynesians believe output gaps can persist in both the short run and the long run, since the Keynesian LRAS has a range where the economy can sit below full-employment output indefinitely.
Classical economists believe markets clear in the long run, so any output gap — positive or negative — is only a short-run phenomenon, with the economy always returning to the full-employment level of output on the vertical LRAS.
Don't assume output gaps are always temporary — that is only true under the classical view. Under the Keynesian view, a negative output gap can persist indefinitely.
Figure 2.23 Long-run aggregate supply
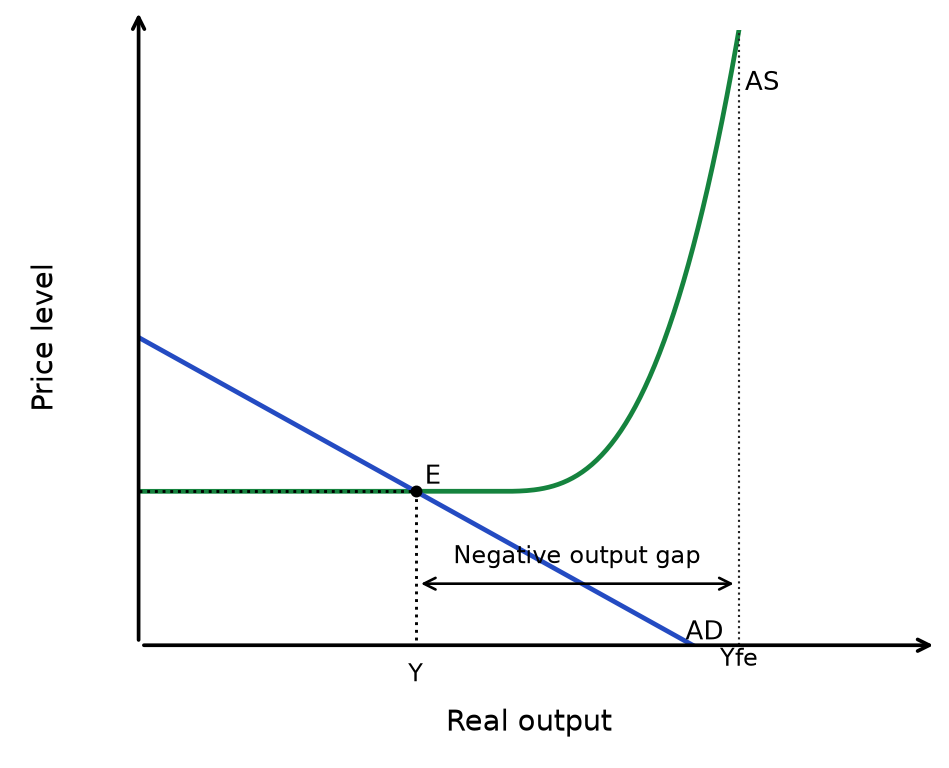
Read the diagram: Find the AD–AS intersection → read actual output on the horizontal axis → compare it with Yfe → output below Yfe indicates a negative output gap. On the flatter section, an AD increase can raise output with little price pressure.
Figure 2.24 Short-run output gaps
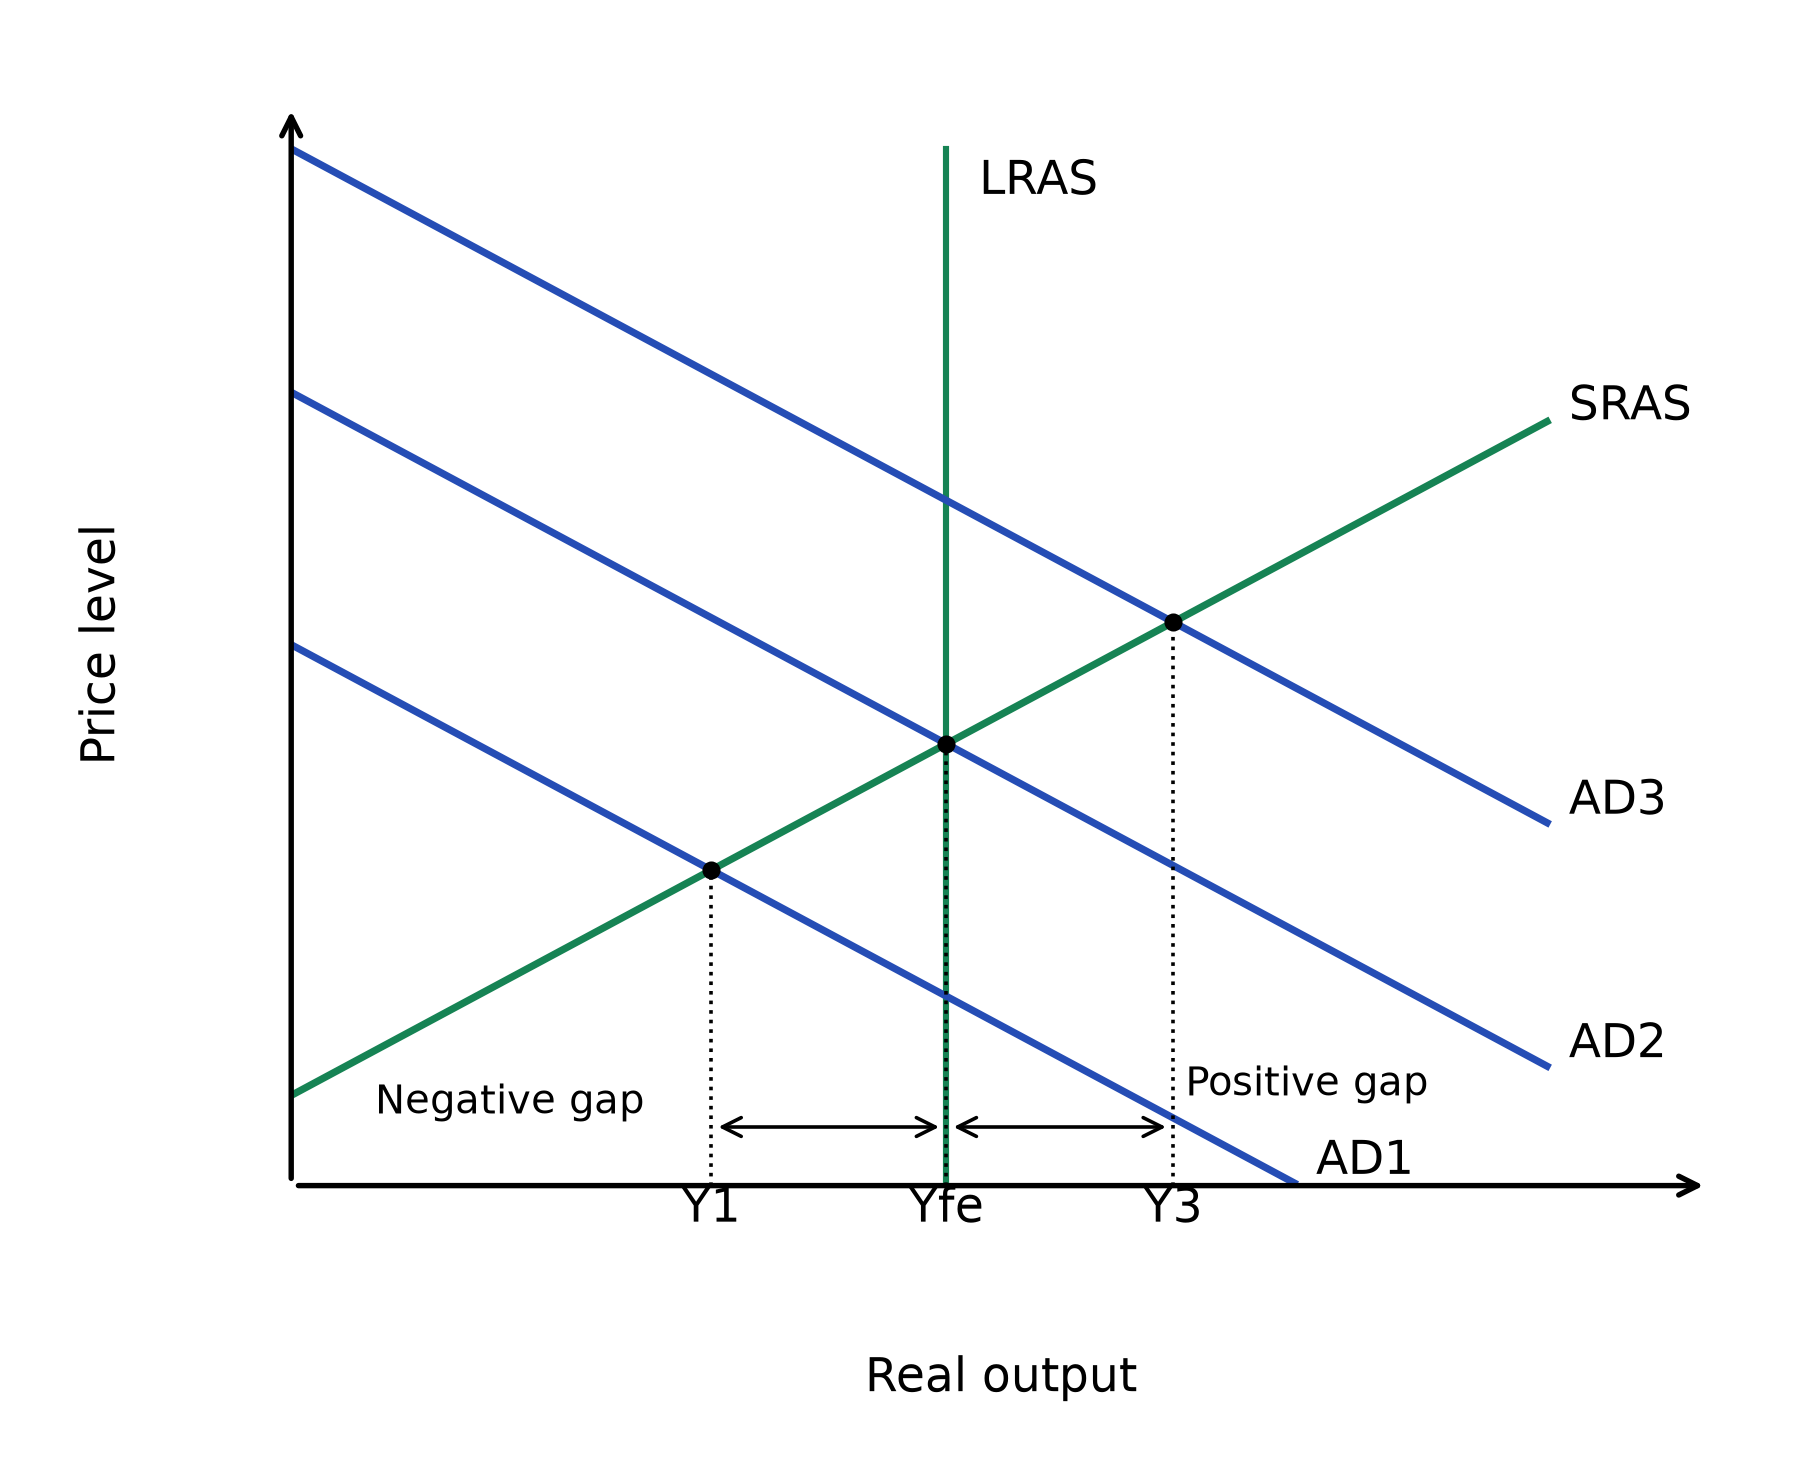
Read the diagram: Different AD positions create short-run equilibria on SRAS below, at or above potential output. In the classical model, price and wage adjustment removes the gap in the long run; LRAS marks capacity, not every short-run outcome.
A common exam evaluation point on measuring output gaps
estimating the underlying trend in the data is difficult, especially since the structure of the economy changes over time — for example, after a recession, some workers can become discouraged and exit the labour force, understating true spare capacity
exchange rate movements can also offset the inflationary pressure implied by a positive output gap
data from some economies (particularly emerging markets) may be unreliable, making extrapolation from past trends uncertain
Recession
- A recession is conventionally defined (in the UK) as two consecutive quarters of negative economic growth.
Recessions are typically characterised by
negative growth
a negative output gap with substantial spare capacity
demand-deficient unemployment
low inflation
a worsening government budget (higher welfare spending, lower tax revenue)
falling consumer/business confidence that further depresses spending and investment
Judge growth through sustainability and distribution as well as GDP. A demand-led expansion near capacity risks inflation, while environmental damage or unequal gains can weaken the improvement in living standards.
Rapid recap
Actual growth raises real output; potential growth raises productive capacity. An output gap compares actual and potential output levels, not their growth rates.
Diagram cue: locate actual and potential output and identify the sign of the gap.
Related chapters: Unit 1 chapter 4 · Unit 2 chapter 9 (p. 90)