Surplus measures gains from exchange and provides a starting point for welfare analysis.
Must know
- Consumer surplus lies below demand and above price.
- Producer surplus lies above supply and below price.
- Government finances and external effects may also matter.
Must know definitions
Consumer surplus: the difference between the price consumers are willing to pay and the price they actually pay; area above market price and below the demand curve.
Producer surplus: receipts above the minimum amount producers require to supply the units sold; the area below market price and above the supply curve.
Economic welfare: the net benefit to society. Market surplus is consumer surplus plus producer surplus; policy analysis must also include government finances and external effects where relevant.
Private benefit: the benefit gained by an individual consumer or producer from a transaction.
Diminishing marginal utility and consumer surplus: as extra units generate less utility, consumers are willing to pay less, so consumer surplus from additional units declines.
Must know relationship: For a triangular surplus area, surplus = ½ × base × height.
Units: base is quantity and height is money per unit, so surplus is a money amount for the stated period. Use the triangle formula only for straight boundaries; compare complete before-and-after areas.
Explain and apply
Mechanism in brief: After a market shock, find the new price and quantity before measuring surplus. A price change alters surplus on existing units, while changed quantity creates or removes surplus on additional units.
Distinguish: Producer surplus is not profit; total consumer surplus is not the surplus from the last unit.
Use the extract: Identify which curve shifts and the relevant price and quantity; compare the complete surplus areas for each group.
The distinction between consumer and producer surplus
Consumer surplus and producer surplus measure gains from market exchange. In a competitive market with no externalities or other distortions, their combined total is maximised at equilibrium; the two surpluses are not each individually maximised there.
- Consumer surplus is the gap between what consumers are willing to pay and what they actually pay.
- Producer surplus sums the difference between the price received and the minimum acceptable price for each unit supplied.
On a diagram
consumer surplus sits above price, below demand; producer surplus sits below price, above supply.
surplus here means net benefit, not excess supply — do not confuse producer surplus with a market surplus (glut).
| Consumer surplus | Producer surplus | |
|---|---|---|
| Definition | The difference between the price consumers are willing and able to pay and the price they actually pay | The difference between the price received and the minimum acceptable price for each unit supplied |
| Based on | The private benefit consumers perceive from consuming the good | Revenue above variable cost in the standard short-run supply diagram. Producer surplus equals economic profit plus fixed cost; it is not the same as profit. |
| On diagram | The area above market price and below the demand curve | The area below market price and above the supply curve |
| Why it exists | Consumers would have been willing to pay more for earlier units, but only pay the equilibrium price | Producers would have been willing to supply earlier units at a lower price, but receive the equilibrium price |
At a fixed price, the surplus from each additional unit generally declines along a downward-sloping demand curve, but total consumer surplus accumulates over the units bought. With straight-line demand curves through the same equilibrium point, a steeper, less elastic demand curve gives a larger surplus triangle; elasticity alone does not determine surplus across unrelated markets.
Figure 1.25 Market equilibrium
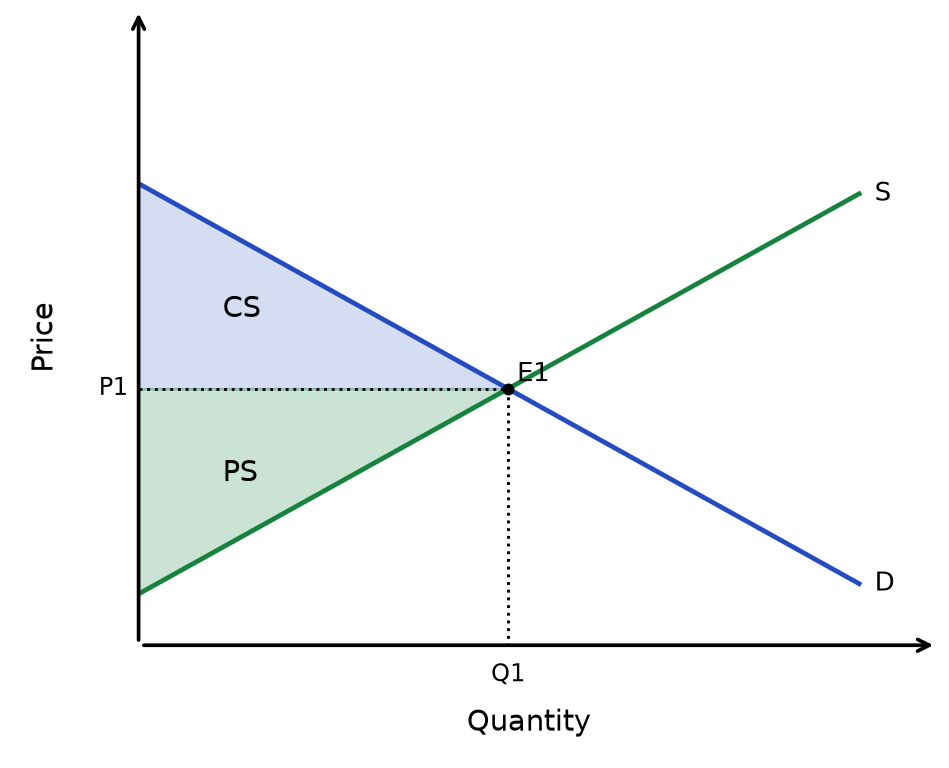
Read the diagram: The demand curve gives willingness to pay and supply represents marginal cost. Shade gains above and below price separately. Combined surplus is a welfare benchmark only under the usual competitive, no-externality assumptions.
How changes in demand or supply might affect consumer and producer surplus
A shift in demand or supply changes the equilibrium price and quantity, and therefore the size of each surplus area.
- Be able to identify the original surplus, the new surplus, and the change in both consumer and producer surplus after a shift.
- With the demand curve unchanged, a supply increase normally lowers price, increases quantity and raises consumer surplus. When demand itself shifts, compare the actual before-and-after areas instead of inferring the result from the price change alone.
Label the curves, prices and quantities, and identify both surplus areas so the change is clear to the reader.
Increasing consumer surplus:
In the usual diagram with a parallel rightward demand shift and an upward-sloping supply curve, equilibrium price and quantity rise and consumer surplus increases. For other curve shapes or shifts, compare the labelled areas.
Figure 1.26 Consumer surplus before and after
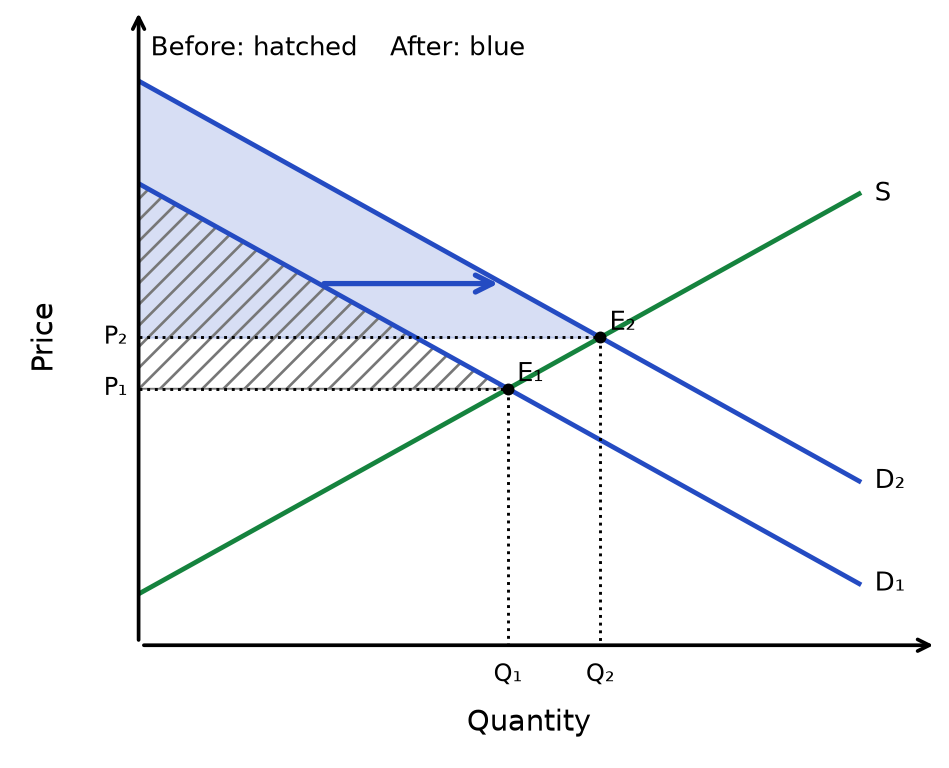
Read the diagram: Demand shifts D₁ → D₂ → equilibrium moves E₁ → E₂, raising P and Q → compare consumer surplus below each demand curve and above its price. Hatching marks the original area; blue marks the new area. Overlap belongs to both. Consumer surplus increases for these parallel linear curves.
Decreasing consumer surplus:
A leftward shift in supply (S1 → S2), e.g. due to higher costs of production, raises market price and reduces consumer surplus.
Figure 1.27 Consumer surplus before and after
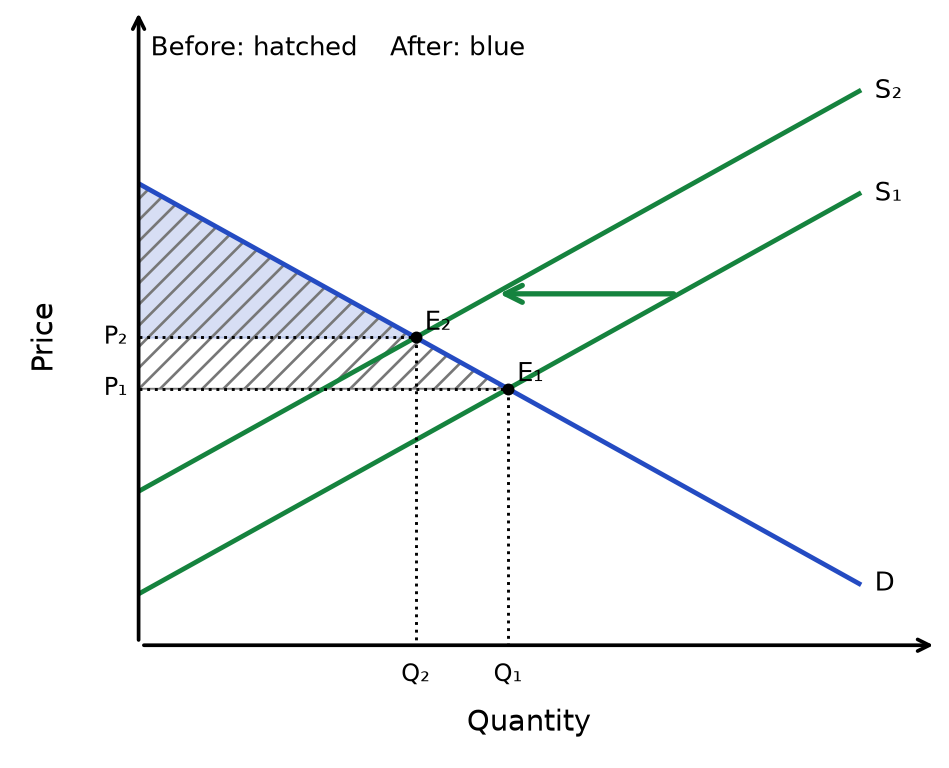
Read the diagram: Supply shifts S₁ → S₂ → equilibrium moves E₁ → E₂, raising P and reducing Q → consumer surplus shrinks below the unchanged demand curve. Hatching marks the original area; blue marks the new area. Compare the full triangles, including their overlap.
Increasing producer surplus:
This can be caused by:
- A rightward supply shift lowers equilibrium price and raises quantity. Its effect on producer surplus depends on the cost reduction and the resulting price and quantity: compare the areas rather than assuming it always rises.
- An increase in demand (D1 → D2) → price rises → producer surplus increases
Figure 1.28 Producer surplus before and after
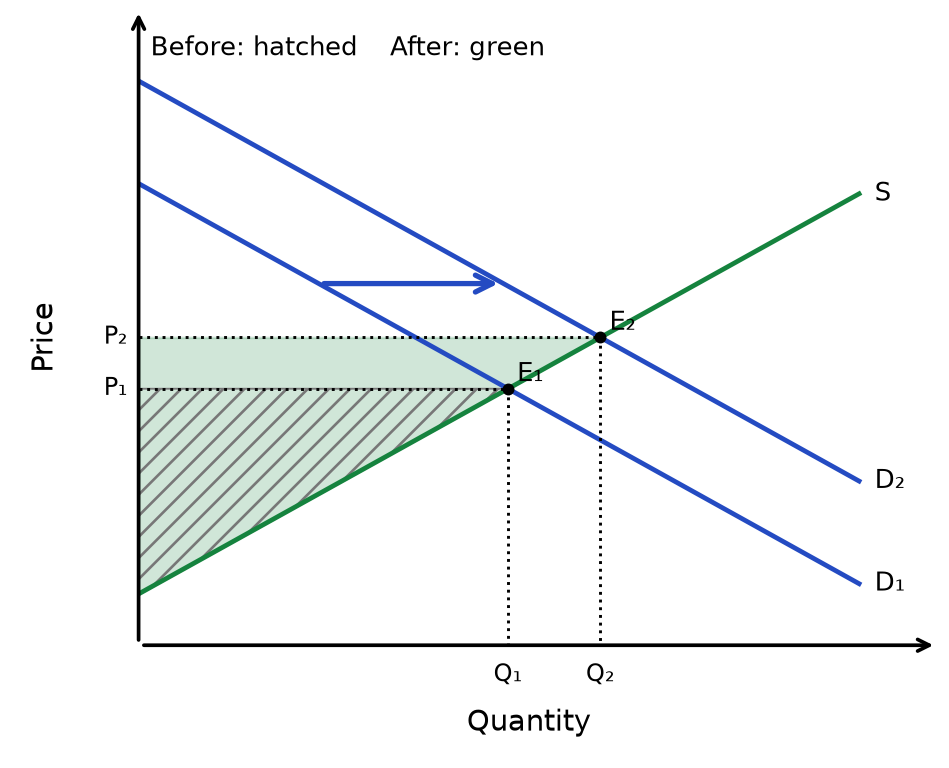
Read the diagram: Demand shifts D₁ → D₂ → equilibrium moves E₁ → E₂, raising P and Q → producer surplus increases above supply and below price. Hatching marks the original area; green marks the new area. Overlap belongs to both. Producer surplus is not the same as profit.
Economic welfare
In a competitive market without externalities, total surplus is consumer surplus plus producer surplus. When evaluating intervention, also account for government revenue or expenditure and relevant external costs and benefits.
- It is important when evaluating the effects of government policies (e.g. taxes, subsidies).
- Such policies can affect either consumer or producer surplus, and therefore change total economic welfare.
Diagram link: Market equilibrium earlier in this topic. Apply the same labels and assumptions to the change described here.
Private surplus is an adequate welfare measure only under the relevant assumptions. Include government finances and external effects when policies or externalities are present; a gain for one group need not be a net social gain.
Rapid recap
Identify: CS is willingness to pay minus payment; PS is receipts minus variable opportunity cost. PS includes fixed-cost recovery and is not profit.
Compare: locate the initial and final equilibria, then measure the complete surplus areas at each. A price change alone does not identify the change in both areas if a curve also shifts.
Judge welfare: include government revenue/spending and external effects where relevant. A larger private surplus does not automatically establish a fairer or socially efficient outcome.
Diagram cue: identify complete consumer and producer surplus areas before and after the shift.
Related chapters: Unit 1 chapter 15 (p. 69) · Unit 1 chapter 16 (p. 80)
Why this connects: Surplus areas provide the welfare language for market failure and intervention. Add government finances and external effects before moving from private gains to a social judgement.