Equilibrium occurs where quantity demanded equals quantity supplied.
Must know
- Excess demand puts upward pressure on price.
- Excess supply puts downward pressure on price.
- A curve shift creates a new equilibrium.
Must know definitions
Market equilibrium: the point where demand equals supply; quantity demanded equals quantity supplied.
Equilibrium price (market clearing price): the price at which the market clears with no excess demand or supply.
Equilibrium quantity: the quantity bought and sold at the equilibrium price.
Excess demand (shortage): when price is below equilibrium, quantity demanded exceeds quantity supplied.
Excess supply (surplus): when price is above equilibrium, quantity supplied exceeds quantity demanded.
Market forces: the pressures of demand and supply that push price back towards equilibrium.
Disequilibrium: when the market is not in equilibrium, i.e. quantity demanded does not equal quantity supplied.
Explain and apply
Mechanism in brief: An increase in demand creates a shortage at the original price. Price rises, causing an extension of supply and contraction of quantity demanded along the new demand curve until the market clears.
Distinguish: Equilibrium need not be socially optimal; a shortage is measured at a specified price.
Use the extract: Identify the affected curve and the initial imbalance; use the extract to justify the direction of price adjustment.
Equilibrium price and quantity and how they are determined
Market equilibrium occurs where the demand and supply curves intersect, so the quantity consumers are willing and able to buy equals the quantity producers are willing and able to sell.
- The price at this intersection is the equilibrium price (or market clearing price).
- The corresponding quantity is the equilibrium quantity.
- At equilibrium, price has no tendency to change because there is no pressure from excess demand or excess supply.
Figure 1.21 Market equilibrium
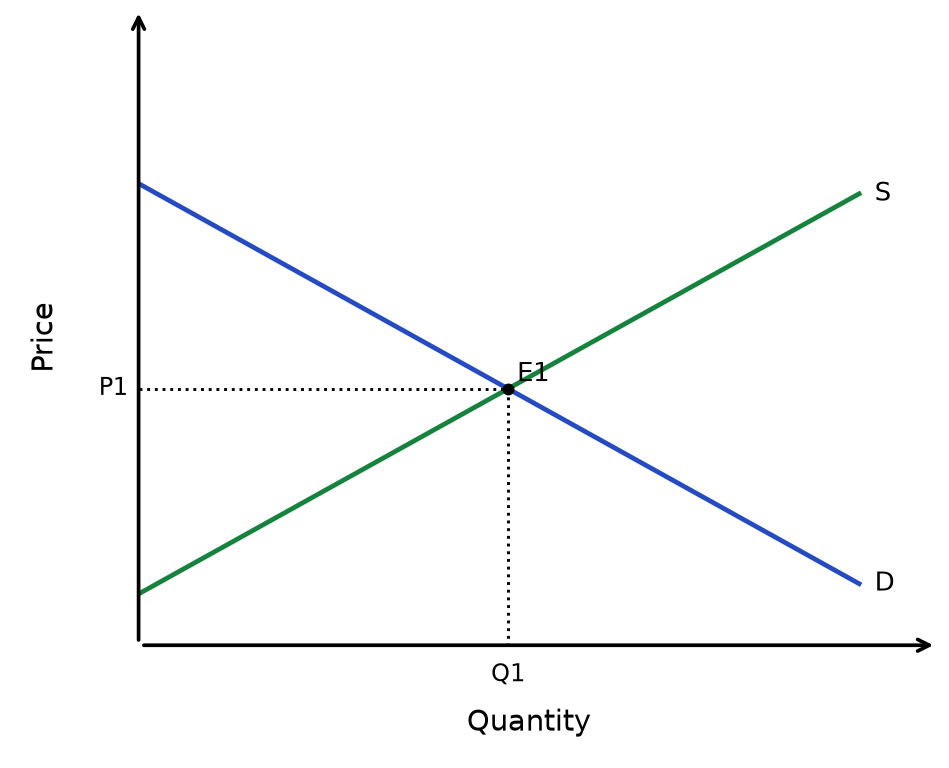
Read the diagram: At the intersection, planned demand equals supply. Read the two equilibrium coordinates from the axes.
Causes of changes in the equilibrium price and quantity as a result of shifts in demand and supply curves
A shift in demand or supply causes a change in the equilibrium price and quantity, and the direction depends on which curve shifts and in which direction.
- A demand shift moves price and quantity in the same direction.
- A supply shift moves price and quantity in opposite directions.
- These shifts are caused by changes in the conditions of demand (PIRATES factors) or conditions of supply (PINTSWC factors).
identify which curve shifts *first*, then read off the new equilibrium — never shift both curves unless the question gives two separate causes.
| Shift | Effect on price | Effect on quantity | Example |
|---|---|---|---|
| Demand shifts right (D ↑) | Price ↑ | Quantity ↑ | Population increases → demand ↑ → new equilibrium at higher P and Q |
| Demand shifts left (D ↓) | Price ↓ | Quantity ↓ | Income falls → demand ↓ → new equilibrium at lower P and Q |
| Supply shifts right (S ↑) | Price ↓ | Quantity ↑ | Costs of production fall → supply ↑ → price falls, quantity rises |
| Supply shifts left (S ↓) | Price ↑ | Quantity ↓ | Indirect tax imposed → supply ↓ → price rises, quantity falls |
Figure 1.22 Market equilibrium
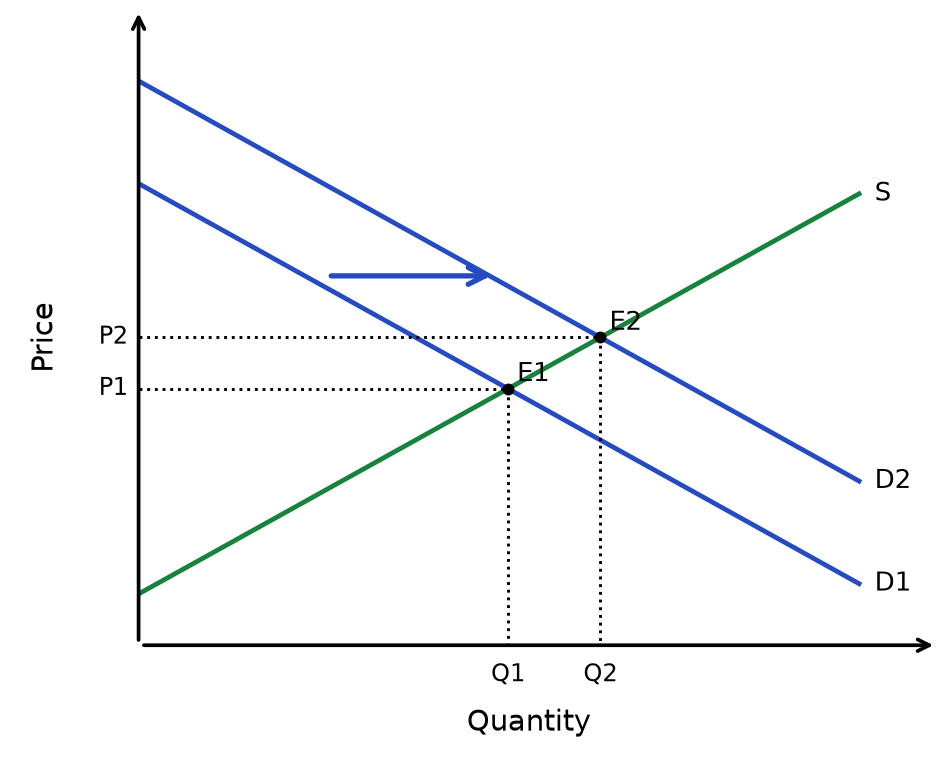
Read the diagram: Identify a non-price determinant that changes demand → shift demand right, holding the other curve fixed → find the new intersection → price rises and quantity rises. The price change causes movement along the unchanged curve. Elasticities determine the size of the response.
The operation of market forces to eliminate excess demand and excess supply
When price is not at equilibrium, market forces operate to restore equilibrium.
- Price below equilibrium creates excess demand (a shortage), so consumers bid prices up.
- Price above equilibrium creates excess supply (a surplus), so firms cut prices to clear unsold stock.
- In both cases supply and demand adjust by movements along the curves — no curve shifts.
excess demand and excess supply are eliminated by movements along the curves, not by shifts of them.
| Excess demand (shortage) | Excess supply (surplus) | |
|---|---|---|
| Cause | Price is below equilibrium | Price is above equilibrium |
| What happens | Quantity demanded > quantity supplied | Quantity supplied > quantity demanded |
| Shortage/surplus | Shortage = Qd − Qs | Surplus = Qs − Qd |
| Market response | Consumers bid up prices → price ↑ → supply expands and demand contracts until equilibrium is restored | Firms lower prices to sell unsold stock → price ↓ → demand expands and supply contracts until equilibrium is restored |
| Result | Price returns to market clearing price | Price returns to market clearing price |
At the price below equilibrium, quantity demanded Qd exceeds quantity supplied Qs: the shortage is Qd − Qs. Upward pressure on price contracts quantity demanded and extends quantity supplied until equilibrium Pe is restored.
Figure 1.23 Excess demand
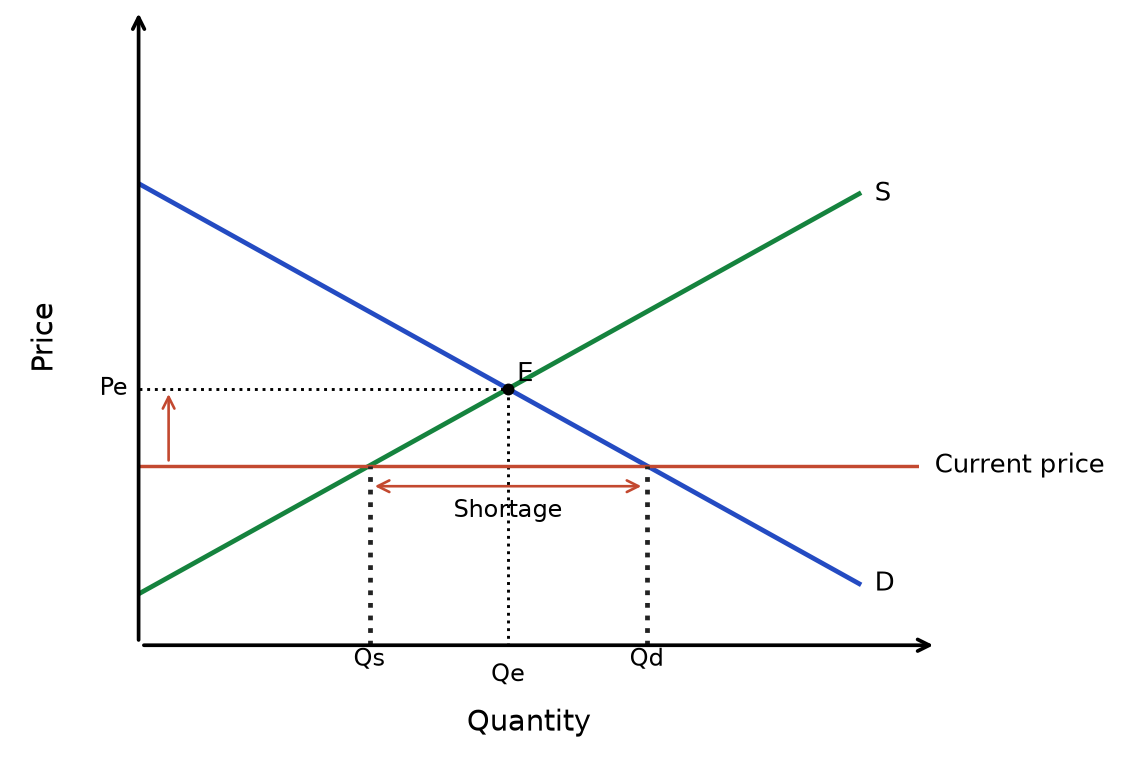
Read the diagram: At a price below equilibrium, quantity demanded exceeds quantity supplied. Buyers bidding for scarce output put upward pressure on price. With no price control, movement along the existing curves restores equilibrium; the curves do not need to shift.
Figure 1.24 Excess supply
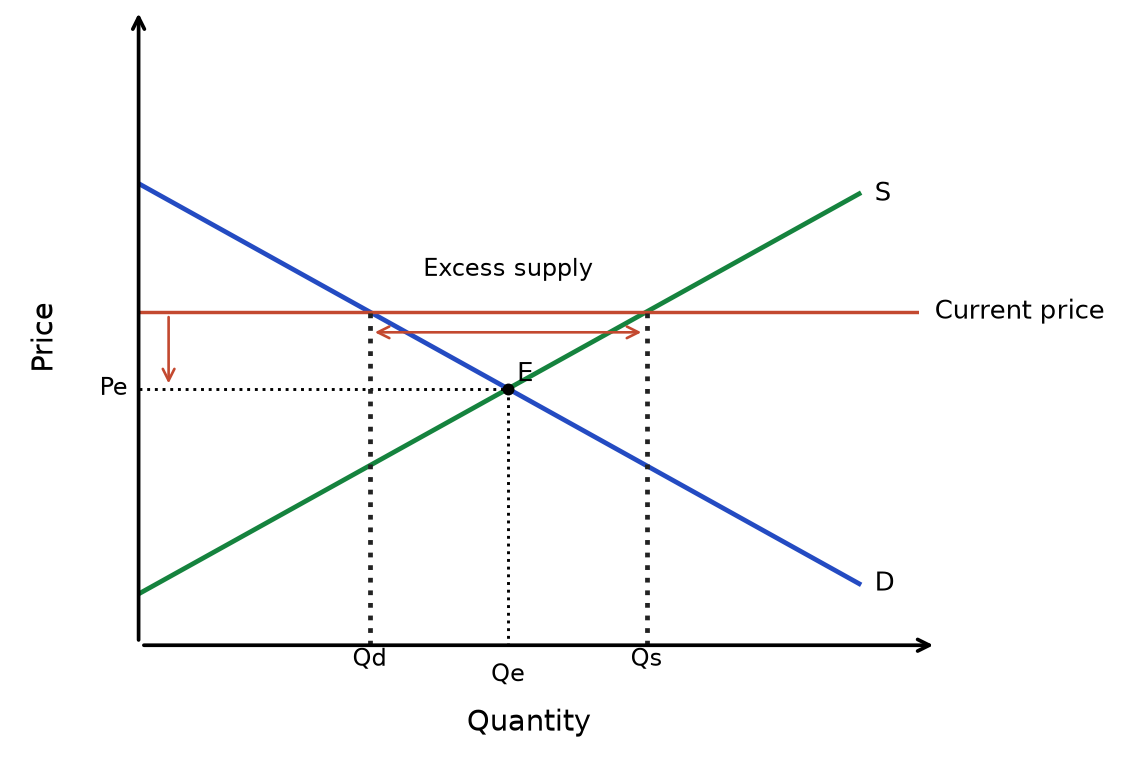
Read the diagram: At a price above equilibrium, quantity supplied exceeds quantity demanded. Unsold output puts downward pressure on price. With no price control, movement along the existing curves restores equilibrium; the curves do not need to shift.
If demand and supply both rise, equilibrium quantity rises but price depends on their relative shifts. A definite price prediction needs evidence on relative size; equilibrium itself does not establish social efficiency.
Rapid recap
Equilibrium is where Qd = Qs. Excess demand puts upward pressure on price; excess supply puts downward pressure on price. Simultaneous shifts can leave one outcome uncertain.
Diagram cue: show the initial equilibrium, justified shift and new price and quantity.
Related chapters: Unit 1 chapter 8 (p. 25) · Unit 1 chapter 10 (p. 41)