Intervention changes incentives or directly changes provision to address a policy objective.
Must know
- Taxes raise a wedge between buyer price and seller receipts.
- Subsidies create a wedge in the opposite direction.
- Binding price controls create shortages or surpluses.
Must know definitions
Market failure: when the free market fails to allocate resources efficiently, justifying government intervention.
Internalise an externality: make decision-makers face the external cost or benefit, for example through a tax, subsidy or enforceable property right, so private incentives better reflect social costs and benefits.
Indirect tax: a tax on expenditure that raises producers' costs, shifting supply left.
Ad valorem tax: a percentage tax on the unit price (e.g. VAT), causing the supply curve to pivot.
Specific tax: a fixed tax per unit, causing a parallel leftward shift of the supply curve.
Incidence of tax: the division of the tax burden between consumers (price rise) and producers (revenue loss).
Subsidy: a government payment to producers to lower costs and encourage output, shifting supply right.
Maximum price: a legal ceiling above which a good cannot be sold. It creates excess demand when binding below the market equilibrium price.
Minimum price: a legal floor below which a good cannot be sold. It creates excess supply when binding above the market equilibrium price.
Tradeable pollution permits: government-issued, tradeable rights to pollute up to a set limit.
Property rights: legal ownership that gives incentive to protect a resource from overuse.
Public good: a good that is non-excludable and non-rivalrous, typically underprovided by the free market due to the free-rider problem.
Must know relationship: Tax revenue or subsidy spending = per-unit wedge × post-policy quantity.
Units: multiply the money amount per unit by the quantity traded after the policy. Consumer tax burden per unit is Pc − P0; producer burden is P0 − Pp, where P0 is the original price.
Explain and apply
Mechanism in brief: A specific tax raises the cost of supplying each unit, reducing traded quantity and creating a wedge between the buyer's price and the producer's receipt. The less responsive side bears more of the burden.
Distinguish: Incidence depends on relative PED and PES; a non-binding price control does not change equilibrium.
Use the extract: Identify the policy level, affected group, elasticities and enforcement; establish whether a price control is binding.
The purpose of government intervention
Government intervention is designed to address market failure — where the free market fails to allocate resources efficiently — and so create a more efficient allocation of resources.
- Intervention aims to move output towards the social optimum.
- It also aims to improve equity and correct externalities and information failures.
Methods of government intervention
Indirect taxes
An indirect tax is a tax on expenditure, imposed on producers, which raises their production costs.
- Higher costs shift supply left, so quantity falls and price rises.
- Used to discourage production/consumption of goods with negative externalities (e.g. cigarettes, alcohol).
- Also used to raise government revenue.
an indirect tax is paid to the government by producers, but its burden is shared with consumers through the higher price.
| Type | Definition | Effect on supply curve |
|---|---|---|
| Ad valorem tax | A percentage of the unit price (e.g. VAT at 20%) | Supply curve pivots — the tax gap widens as price/quantity rises |
| Specific tax | A fixed amount per unit, regardless of price (e.g. fuel duty) | Supply curve shifts left in parallel — a constant vertical gap between S and S+Tax |
Figure 1.35 Ad valorem tax
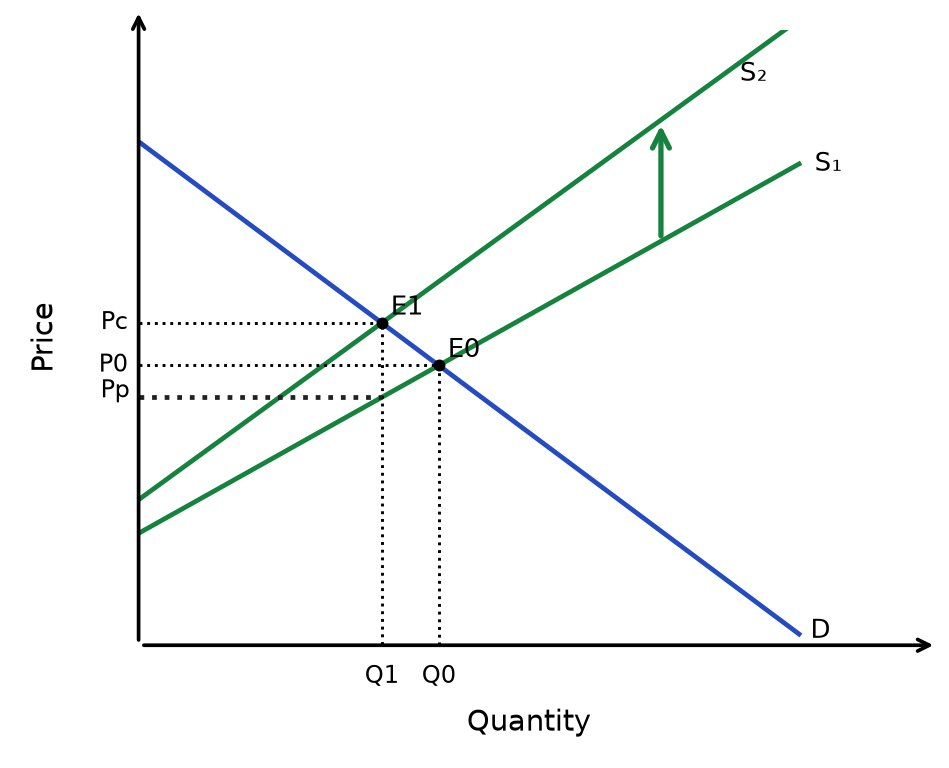
Read the diagram: An ad valorem tax is a percentage of the producer price. The tax-inclusive supply curve has a growing vertical wedge as the underlying price rises, unlike a constant per-unit tax. Pc is paid by buyers and Pp is retained by sellers.
Figure 1.36 Tax incidence
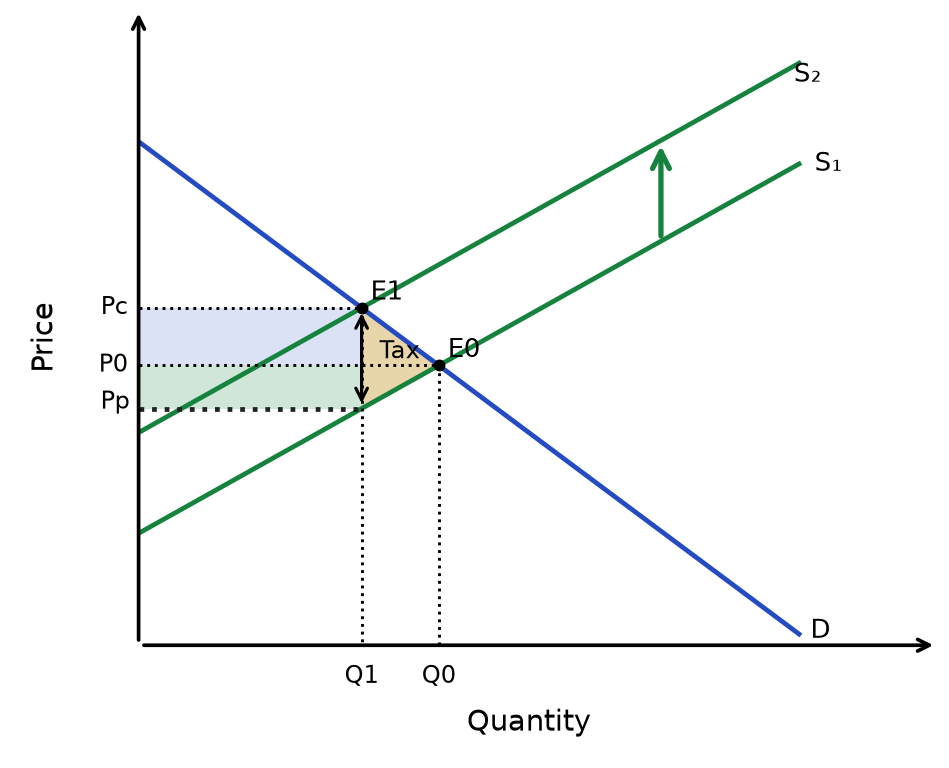
Read the diagram: Tax shifts S₁ upward to S₂ → find the new intersection with D → read consumer price Pc and quantity Q1 → read producer receipts Pp from S₁ at Q1. The wedge Pc − Pp is the tax; tax revenue is that wedge × Q1. Compare the original Q0 with Q1 to locate lost trades.
Incidence of indirect taxes: consumers pay a higher price and producers receive a lower price net of tax. The less price-elastic side bears more of the tax. The comparisons below hold the supply curve unchanged; whether consumers bear most depends on PED relative to PES.
| PED of the good | Incidence on consumer | Incidence on producer | Mechanism |
|---|---|---|---|
| Less elastic demand (smaller |PED|), with PES unchanged | Larger share than with more elastic demand | Smaller | With supply unchanged, less elastic demand means consumers bear a larger share than with more elastic demand. Consumers bear most of the tax only when demand is less elastic than supply. |
| More elastic demand (larger |PED|), with PES unchanged | Smaller | Larger share than with less elastic demand | Consumers are highly responsive to price changes, so if producers pass on the tax, many consumers stop buying — producers must absorb more of the tax to retain sales |
Government revenue from the tax = (price paid by consumer − price received by producer) × quantity sold after tax. Revenue is higher when demand is inelastic, since quantity falls only slightly.
Linking taxes to negative externalities: if the government sets the tax equal to the marginal external cost of each unit, the supply curve shifts from MPC to MSC — this internalises the externality, meaning the polluter pays for the damage caused. The market equilibrium moves from the private optimum (where MPC = MPB) to the social optimum (where MSC = MSB), correcting the over-production. Governments impose taxes on goods such as cigarettes and alcohol to reduce consumption and raise tax revenue to fund education and healthcare.
Figure 1.37 Tax incidence — Less elastic demand
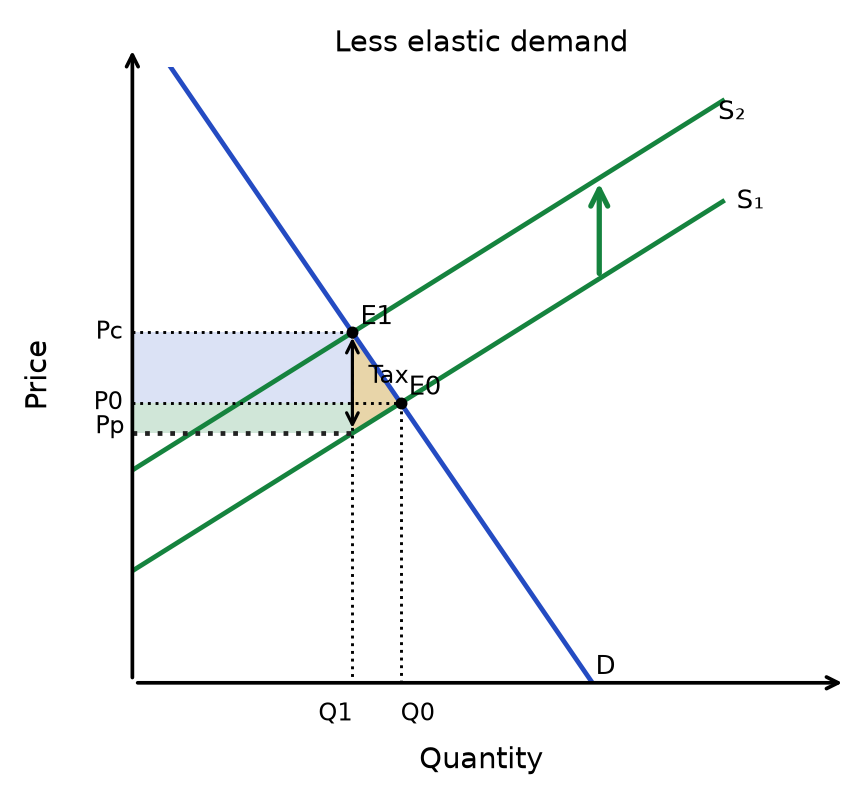
Figure 1.38 Tax incidence — More elastic demand
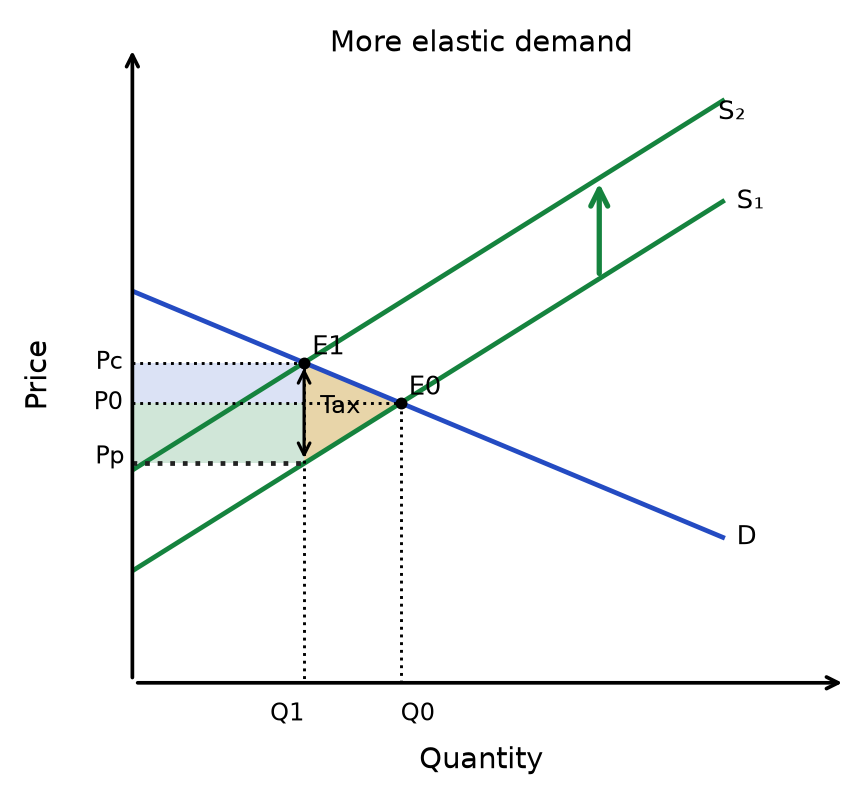
Read the diagram: Consumers pay Pc and producers receive Pp after the tax. The vertical wedge times Q1 is revenue. The blue rectangle is consumer incidence and the green rectangle producer incidence; the gold triangle is deadweight loss under the no-externality assumptions. Both panels start at the same equilibrium and use the same supply curve and tax. Less elastic demand gives consumers a larger share of the burden.
Subsidies
A subsidy is a payment from the government to a producer to lower their costs of production and encourage them to produce more.
- Subsidies increase supply, shifting the supply curve right, so quantity rises and price falls.
- Used to encourage production/consumption of goods with positive externalities (e.g. merit goods like recycling or education).
- The benefit is shared between consumers (lower price) and producers (more revenue per unit).
Incidence of subsidies: consumers pay a lower price and producers receive a higher price including the subsidy. The less price-elastic side receives more of the benefit. The comparisons below hold the supply curve unchanged; absolute incidence depends on PED relative to PES.
| PED of the good | Benefit to consumer | Benefit to producer | Mechanism |
|---|---|---|---|
| Less elastic demand (smaller |PED|), with PES unchanged | Larger consumer share than with more elastic demand | Smaller | With supply unchanged, less elastic demand means a greater part of the subsidy lowers the price paid by consumers; the remainder raises the producer’s receipt per unit. |
| More elastic demand (larger |PED|), with PES unchanged | Smaller | Larger producer share than with less elastic demand | With supply unchanged, more elastic demand means a smaller part of the subsidy lowers the consumer price and a greater part raises the producer’s receipt per unit. |
Government subsidy spending = (price producers receive − price consumers pay) × post-subsidy quantity. The incidence rectangles divide this payment across consumers and producers; they are not the exact changes in CS and PS. Without a corrective external benefit, the rise in CS + PS is smaller than government spending by the deadweight loss.
A subsidy to producers lowers their effective marginal cost and shifts supply down/right. For a positive consumption externality, a per-unit subsidy equal to the marginal external benefit at the social optimum can increase market output to that optimum. Keep MPB and MSB distinct: the policy does not itself change the underlying benefit curves.
Figure 1.39 Subsidy incidence
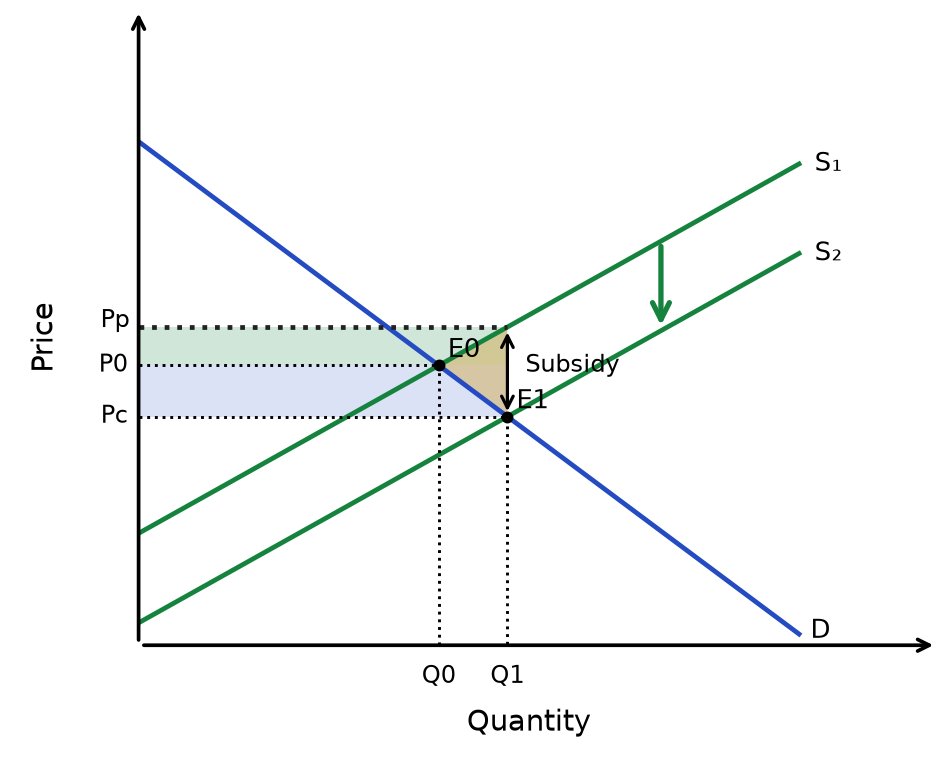
Read the diagram: Consumers pay Pc while producers receive Pp including the subsidy. The blue and green rectangles allocate the price-incidence benefit across post-subsidy units; they are not exact changes in total surplus; government spending is the full wedge times Q1. The gold triangle is overproduction loss only when there is no corrective external benefit.
Maximum price
A maximum price is a legal price ceiling set by the government where a good cannot be sold above this price.
- Used to encourage consumption of a good by keeping it affordable.
- To be effective, the maximum price (Pmax) must be set below the free market equilibrium price (P).
- Firms contract supply (lower price) while consumers extend demand, creating excess demand / a shortage equal to Qd − Qs.
- The shortage may require rationing or lead to black markets. Example: Cyprus introducing a maximum price on milk.
a maximum price set *above* equilibrium has no effect at all.
Figure 1.40 Maximum price
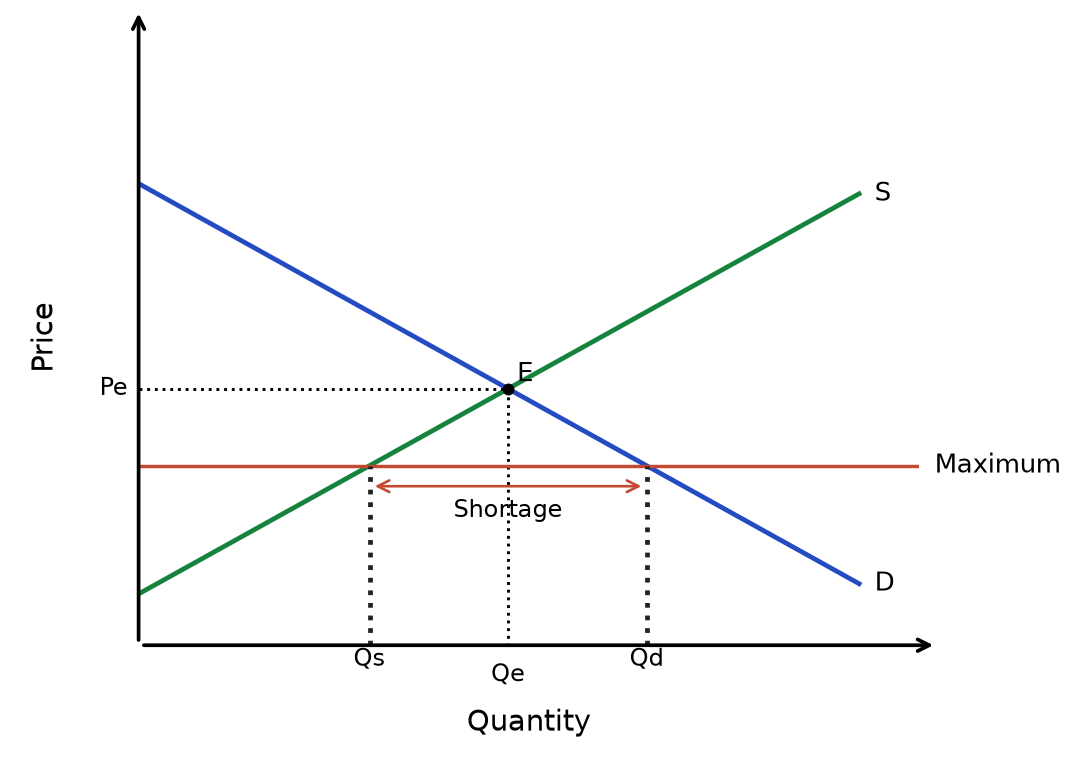
Read the diagram: A binding ceiling below equilibrium makes quantity demanded exceed quantity supplied. The gap is a shortage. A control on the other side of equilibrium is non-binding.
Minimum price
A minimum price is a legal price floor set by the government where a good cannot be sold below this price.
- Used to discourage consumption of a good, or to protect suppliers (e.g. the National Minimum Wage).
- To be effective, the minimum price (Pmin) must be set above the free market equilibrium price (P).
- Firms extend supply (higher price) while consumers contract demand, creating excess supply / a surplus / a glut equal to Qs − Qd.
- A minimum wage set above the equilibrium wage can cause unemployment. Example: Scotland's minimum price for alcohol.
Figure 1.41 Minimum price
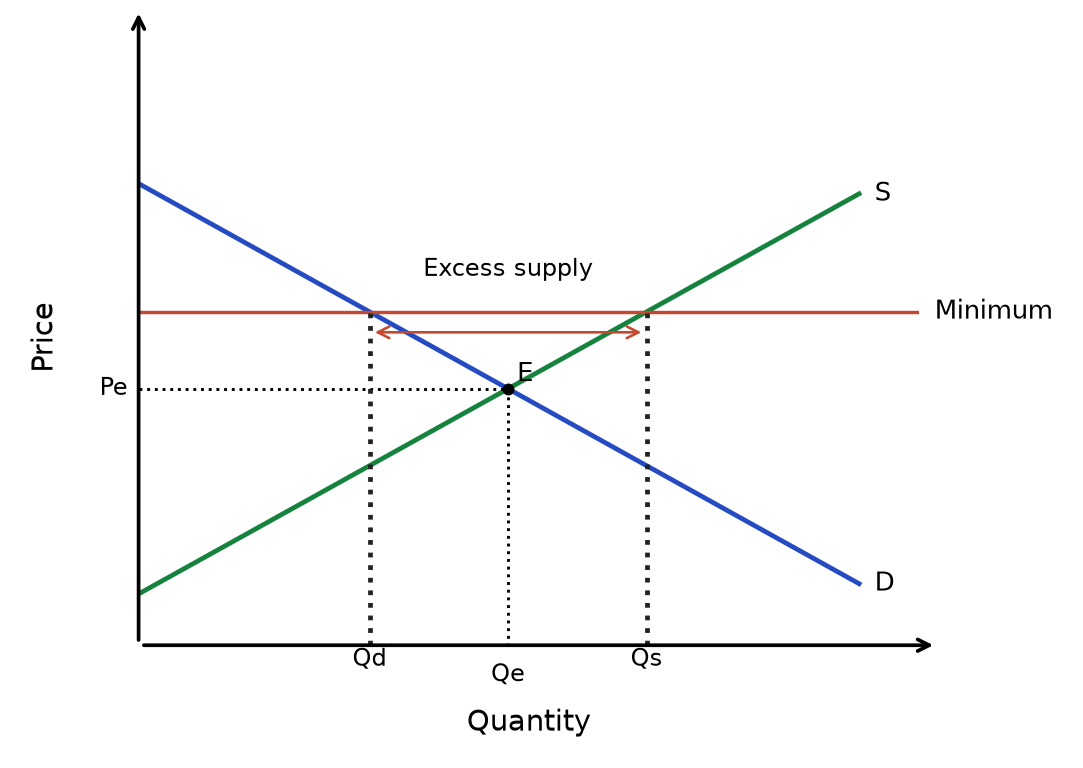
Read the diagram: A binding floor above equilibrium makes quantity supplied exceed quantity demanded. The gap is excess supply. A control on the other side of equilibrium is non-binding.
Other methods of intervention
| Method | How it works | Advantages | Disadvantages |
|---|---|---|---|
| Tradeable pollution permits | Government sets a pollution limit and issues permits; firms can trade surplus permits | Encourages lower pollution; raises government revenue if permits are auctioned or sold; firms with surplus permits can earn revenue by selling them | Firms may relocate to avoid limits; costs passed to consumers; expensive to monitor |
| Extension of property rights | Allocating ownership rights encourages owners to protect a resource and sue polluters | Protects the environment by giving owners incentive and legal power | Difficult to allocate/enforce for shared resources (e.g. oceans, air) |
| State provision of goods and services | Government funds or directly supplies public goods (e.g. flood defences) and may also supply merit goods such as education and healthcare. | Can address the free-rider problem for public goods, and information failure or external benefits for merit goods. | Expensive; opportunity cost of government spending |
| Regulation | Government imposes legal rules on production/consumption, backed by fines or bans | Directly restricts harmful behaviour; positive externalities (e.g. higher skilled workforce from compulsory schooling) | Costly to police; may push activity onto the black market |
| Provision of information | Government supplies information to correct information gaps/asymmetric information | Reduces information failure so consumers/firms make informed decisions | Can be expensive to provide and enforce |
Impact on consumers, producers, and government:
| Consumers | Producers | Government | |
|---|---|---|---|
| Indirect tax | Pay a higher price → reduced consumer surplus; consume less of the good | Receive a lower price per unit → reduced producer surplus; produce less | Gain tax revenue; can fund public services |
| Subsidy | Pay a lower price → increased consumer surplus; consume more of the good | Receive a higher price per unit → increased producer surplus; produce more | Bear the cost of the subsidy; opportunity cost of government spending |
A policy succeeds when its benefits exceed implementation costs and unintended losses relative to the alternative. Inelastic demand may protect tax revenue but limit behavioural change; enforcement and policy size affect both outcomes.
Rapid recap
Price controls: a binding ceiling below equilibrium creates excess demand; a binding floor above equilibrium creates excess supply. Outcomes also depend on allocation, enforcement and any government purchases.
Tax and subsidy: identify the wedge, the new traded quantity and prices paid/received. The relatively less elastic side bears more tax burden or receives more subsidy benefit.
Welfare: include revenue or spending, external benefits/costs and implementation costs. Judge the policy against its objective, not price changes alone.
Diagram cue: show the relevant tax, subsidy or binding price control and its incidence.
Related chapters: Unit 1 chapter 9 (p. 31) · Unit 1 chapter 17 (p. 90)