A change in the good's own price changes quantity demanded; another determinant can shift demand.
Must know
- Demand requires willingness and ability to pay.
- Own price causes a movement along demand.
- Income tastes population and related prices can shift demand.
Must know definitions
Demand: the amount consumers are willing and able to buy at a given price, in a given time period.
Demand curve: shows the relationship between price and quantity demanded; slopes downward.
Expansion (extension) of demand: a movement along the demand curve caused by a fall in price.
Contraction of demand: a movement along the demand curve caused by a rise in price.
Shift of demand: a change in quantity demanded at every price level, caused by a non-price factor.
Marginal utility: the additional satisfaction gained from consuming one more unit.
Law of diminishing marginal utility: as more units of a good are consumed, marginal utility falls.
Substitute good: a good that can replace another in consumption (e.g. different TV brands).
Complement good: a good consumed together with another (e.g. strawberries and cream).
Explain and apply
Mechanism in brief: A higher price increases the sacrifice required to buy the good and makes alternatives relatively more attractive. Quantity demanded falls along the existing curve, holding other influences constant.
Distinguish: Demand is not the same as quantity demanded; higher income need not raise demand for every good.
Use the extract: Identify whether own price, income or a related good's price changed; classify the good before choosing the shift.
The concept of 'demand'
Demand is the amount that consumers are willing and able to buy at any given price, in a given period of time.
- A demand curve shows the relationship between price and quantity demanded, with price on the vertical axis and quantity on the horizontal axis.
It slopes downwards from left to right
a fall in price makes a good more affordable, so consumers are willing to buy more.
This inverse relationship between price and quantity demanded is the basis of the "law of demand".
demand means willing and able to buy — desire alone is not demand.
The distinction between movements along a demand curve and shifts of a demand curve
A movement along the demand curve is caused only by a change in the price of the good itself, while a shift of the whole curve is caused by a change in a non-price factor.
- Changing price never shifts the curve — it only moves consumers to a different point on the same curve.
- If price falls from £8 to £6, quantity demanded might rise from 150,000 to 160,000 shirts — an expansion (extension) of demand.
- If price rises instead, quantity demanded falls — a contraction of demand.
name the cause first: the good’s own price changes quantity demanded along D; a non-price determinant shifts D. This avoids confusing a movement with a shift.
| Cause | Effect | Terminology | |
|---|---|---|---|
| Movement along the curve | Change in the price of the good itself | Fall in price → quantity demanded rises; rise in price → quantity demanded falls | Expansion (extension) / contraction of demand |
| Shift of the curve | Change in a non-price factor (e.g. income, tastes) | More or less demanded at every price level | Increase in demand: rightward shift. Decrease in demand: leftward shift. |
Figure 1.2 Movement along D
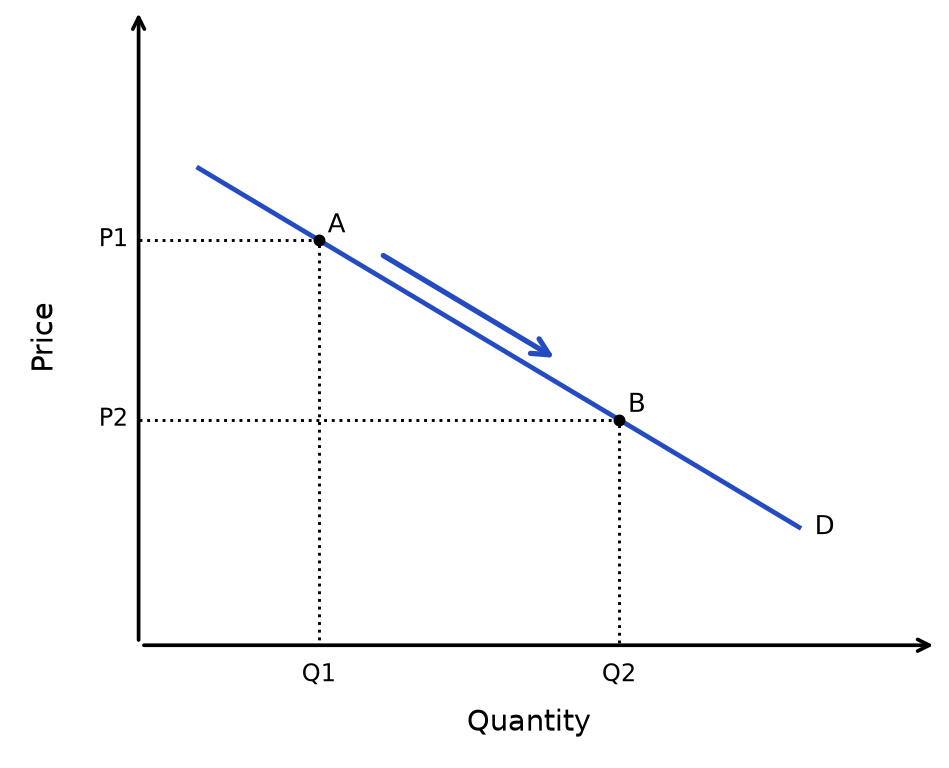
Read the diagram: The good’s own price changes and other determinants are held constant. The arrow shows movement from A to B along the same curve. Quantity changes; the curve does not shift.
Figure 1.3 Shifts of D — Increase
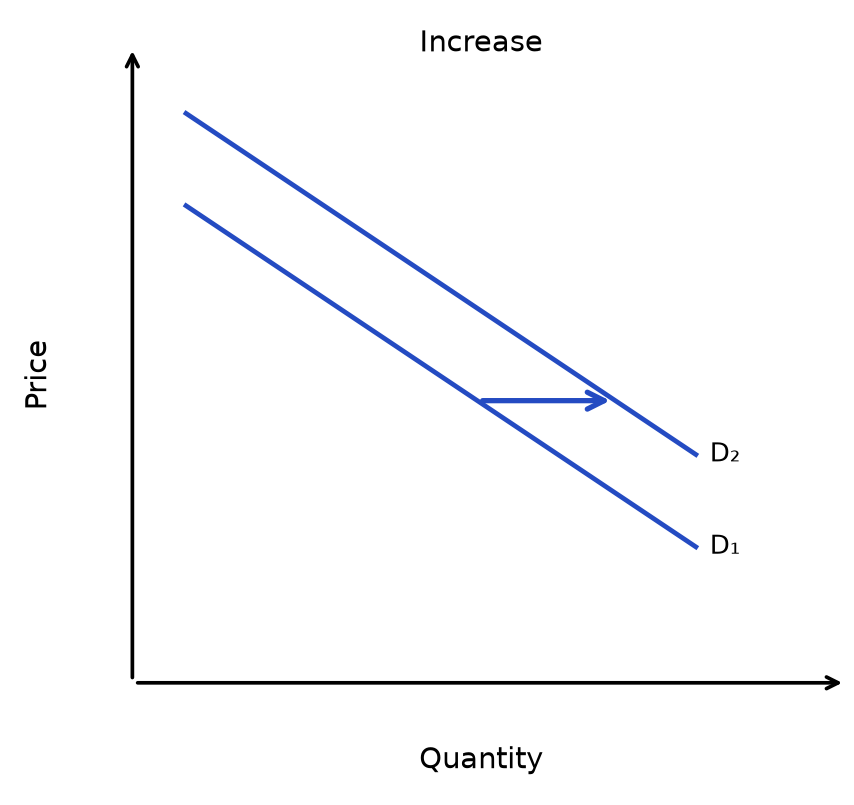
Figure 1.4 Shifts of D — Decrease
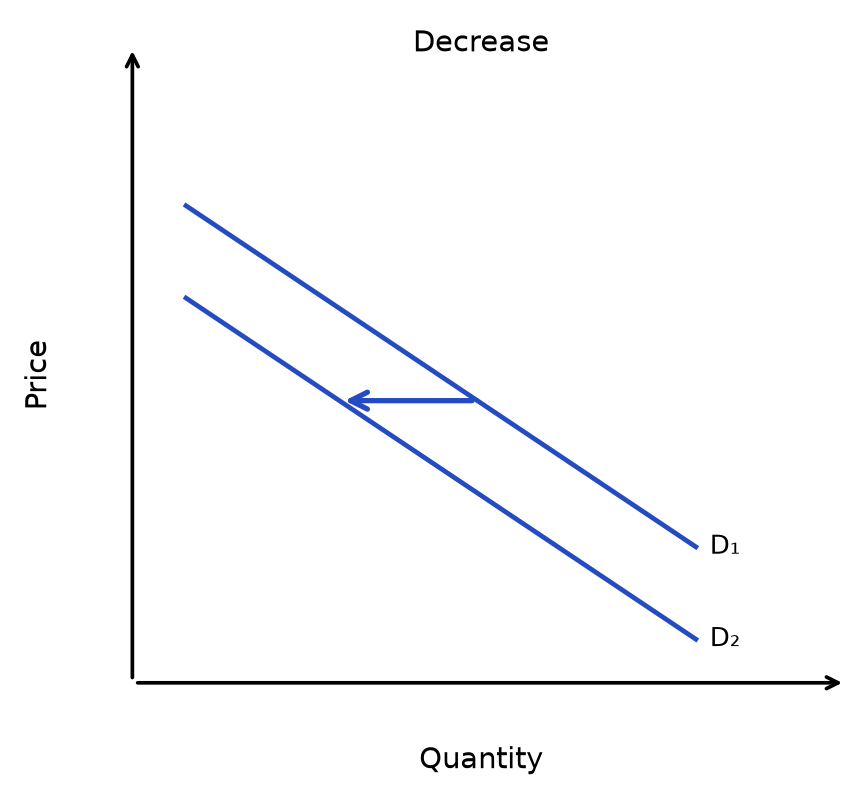
Read the diagram: Each panel shows a change in a non-price determinant, holding other influences fixed. The arrow runs from curve 1 to curve 2: an increase is a rightward shift; a decrease is a leftward shift. Compare quantities at the same vertical-axis value.
The concept of diminishing marginal utility
Marginal utility is the additional satisfaction gained from consuming one more unit of a good.
- Total utility normally keeps rising as more units are consumed, but marginal utility usually falls with each extra unit — the law of diminishing marginal utility.
- A first chocolate bar satisfies hunger strongly, so the consumer is willing to pay more for it.
- A second bar satisfies less, so they will only pay less; eventually marginal utility falls to zero.
- This explains why demand curves slope downwards — consumers only pay lower prices for additional units as satisfaction diminishes.
it is marginal utility that falls, not total utility.
Factors that may cause a shift in the demand curve
Any change in a non-price determinant of demand shifts the entire curve outward (more demanded at every price) or inward (less demanded at every price).
- These factors are commonly remembered using the PIRATES mnemonic.
- An outward shift means more is demanded at *every* price, not just at the current price.
| Factor | Explanation | Effect on demand |
|---|---|---|
| P – Population | A larger population, or a change in its age distribution, changes the number of potential buyers | Population ↑ → demand ↑ (outward shift) |
| I – Income | Real income changes purchasing power; the direction of the demand shift depends on whether the good is normal or inferior. | For a normal good: income ↑ → demand shifts right. For an inferior good: income ↑ → demand shifts left. |
| R – Related goods | Substitutes: if a substitute's price falls, demand for the original good falls. Complements: if the price of strawberries rises, demand for cream falls | Depends on direction of price change |
| A – Advertising | Increases brand loyalty and awareness, encouraging more consumption | Effective advertising → demand ↑ (outward shift) |
| T – Tastes and fashions | Changing preferences alter desire for a good, e.g. e-books replacing physical books | Favourable trend → demand ↑ |
| E – Expectations | If consumers expect prices to rise in future, they buy more now | Expected price rise → demand ↑ now |
| S – Seasons | Some goods are demanded more in certain seasons, e.g. ice cream in summer | Relevant season → demand ↑ |
If the price of good A rises, quantity demanded of A contracts along its own demand curve. Demand for a substitute B may shift right, while demand for a complement C may shift left. Distinguish the own-price movement from the related good’s demand shift.
Identify the good and the cause before predicting the shift. Higher income need not increase demand for every product; the sign of YED and the availability of substitutes determine the relevant response.
Rapid recap
Own-price changes move quantity demanded along D. Income, tastes and related-good prices shift D. Income growth shifts demand right for a normal good and left for an inferior good.
Diagram cue: distinguish movement along D from a shift of D, with arrows.
Related chapters: Unit 1 chapter 9 (p. 31) · Unit 1 chapter 12 (p. 53)