A monopsonist has buying power and faces the consequences of raising the price paid for inputs.
Must know
- Input supply can slope upward.
- Marginal expenditure can exceed average expenditure.
- Buying power can reduce the price and quantity purchased.
Must know definitions
Monopsony: a market structure with a single (or dominant) buyer, giving it the power to set the price paid to suppliers.
Monopsony power: the ability of a buyer to negotiate prices below the competitive level because suppliers have limited alternative buyers.
Explain and apply
Mechanism in brief: Hiring another worker requires a higher wage on the upward-sloping supply curve. If all comparable workers receive it, marginal labour cost exceeds the new worker's wage, restricting employment relative to the competitive benchmark.
Distinguish: Monopsony concerns buying power; monopoly concerns selling power.
Use the extract: Look for a dominant buyer and limited alternatives for suppliers or workers; separate buying power from selling power.
Figure 3.20 Monopsony equilibrium
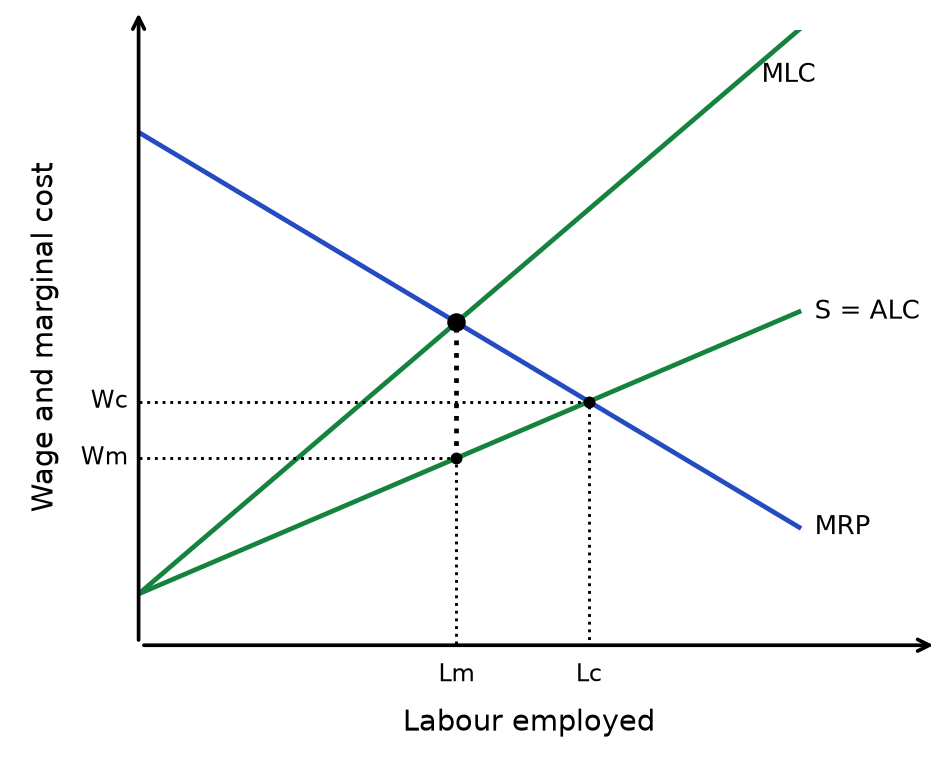
Read the diagram: Find Lm at the MRP–MLC intersection → follow the dotted guide down to supply (S = ALC) → read Wm on the wage axis → compare with competitive Lc and Wc at supply = MRP. Wage is read from supply, not from the MLC intersection.
Assumptions: one wage is paid to all workers on an upward-sloping labour supply curve. Hiring more workers raises the wage on existing workers too, so MLC lies above supply.
Assumptions and conditions for a monopsony to operate
A monopsony exists when there is a single buyer in a market.
- Pure monopsonists are rare in practice — examples include Network Rail as the sole buyer of track maintenance services, or a government dominating the market for hiring teachers, while large supermarkets have monopsony power when buying produce from farmers.
- Monopsonists are assumed to be profit maximisers who aim to minimise costs by paying suppliers the lowest possible price, and because suppliers have nowhere else to sell, the monopsonist can set the market price rather than accept it.
sole buyer in the market → suppliers have no alternative buyer → monopsonist can negotiate/set a price below the competitive level → suppliers respond by supplying less to the market
Costs and benefits of a monopsony to firms, consumers and employees
| Stakeholder | Benefits | Costs |
|---|---|---|
| Monopsony firms | Cost minimisation supports higher profits | Relationship with suppliers may worsen; the monopsonist may drive suppliers out of business |
| Consumers | Lower prices, since the monopsonist pays suppliers the minimum it can and can pass some savings on | The supplier may cut corners or lower quality to stay profitable at the lower price it receives |
| Employees | Minimising costs of raw materials/supplies leaves more funds available to pay staff | May question the ethics of how their firm treats suppliers |
| Suppliers to monopsonists | If a supplier itself has market power (e.g. as a monopolist), it can counteract the monopsonist's bargaining power | The buyer minimises costs by paying less or later; suppliers may be driven out of the market if they cannot make a profit |
Real-world example: supermarket monopsony power has repeatedly been blamed for squeezing farmers' profits, as chains negotiate ever-lower prices from suppliers to compete on price with rival supermarkets, leaving many farmers earning only normal profit at best.
- By contrast, the NHS's monopsony power when buying drugs from pharmaceutical companies lets it negotiate lower prices, freeing up budget to fund more treatments and R&D elsewhere.
monopsony pays below the competitive price → supplier's profit margin ↓ → supplier may cut quality, reduce output, or exit the market, ceteris paribus
Efficiency assessment
| Efficiency type | Achieved? | Reasoning |
|---|---|---|
| Allocative efficiency | No | The monopsonist pays suppliers below the competitive price and buys a lower quantity than the competitive level, so the price paid does not reflect the marginal value of the resource |
| Productive efficiency | Limited | Cost minimisation on the input side can lower the monopsonist's own average costs, but this comes at the expense of squeezing supplier margins rather than genuine productive efficiency gains |
| Dynamic efficiency | Limited | Cost savings can free up funds for the monopsonist's own investment or R&D (e.g. NHS drug savings), but suppliers facing lower margins have less capacity to invest or innovate themselves |
| Economies of scale | Possible | Monopsonists are typically large buyers, and their scale of purchasing is exactly what gives them the bargaining power to negotiate lower input prices |
Impact on stakeholders
| Stakeholder | Pros | Cons |
|---|---|---|
| Consumers | Lower input costs can be passed on as lower prices | Quality may fall if squeezed suppliers cut corners to stay profitable |
| Producers (monopsony firm) | Lower costs support higher profits; savings can be redirected to investment or covering more services within a fixed budget | Long-run damage to supplier relationships if driven too far; reputational risk |
| Government | Public-sector monopsony buying (e.g. the NHS) stretches a fixed budget further | May need to regulate against exploitative buying power over vulnerable suppliers |
| Labour | More funds may be available to pay a monopsonist's own staff since input costs are minimised | Employees of squeezed suppliers may face job losses or reduced wages if their employer's margins are driven too low |
| Society | — | Suppliers exiting the market from unsustainable margins (e.g. farmers) can reduce diversity and resilience of supply chains |
Buying power is weaker when suppliers or workers can switch easily. Lower purchase costs may benefit final consumers if passed on, but reduced supplier income and investment can impose longer-run costs.
Rapid recap
Decision: choose employment where MRP = MLC, then read the wage from labour supply/ALC. When a higher wage must be paid to all workers, MLC exceeds that wage.
Comparison: the standard monopsony chooses lower employment and wages than competition. A suitably set minimum wage can raise both; a sufficiently high floor can reduce employment.
Judge: worker mobility, employer competition and enforcement affect buying power and the response. Do not apply the competitive wage-floor result automatically.
Diagram cue: find employment at MRP=MLC and read the wage from supply.
Related chapters: Unit 3 chapter 15 (p. 72) · Unit 3 chapter 17 (p. 79)