Cost curves explain how additional output changes average and marginal production costs.
Must know
- TC equals TFC plus TVC.
- AC equals AFC plus AVC.
- MC crosses average cost curves at their minima in the standard model.
Must know definitions
Diminishing marginal productivity (law of diminishing returns): as more units of a variable factor are added to a fixed factor, the marginal product of each additional unit eventually falls.
Total cost (TC): TFC + TVC.
Total fixed cost (TFC): costs that do not vary with output in the short run.
Total variable cost (TVC): costs that vary with output; they need not rise in direct proportion to output.
Average (total) cost (ATC): TC ÷ quantity.
Marginal cost (MC): ΔTC ÷ ΔQ, the cost of producing one more unit.
Long-run average cost (LRAC) curve: the envelope of all short-run average cost curves, showing the lowest achievable average cost at each output when all factors are variable.
Must know relationship: TC = TFC + TVC; AC (also ATC) = TC / Q = AFC + AVC; MC = ΔTC / ΔQ.
Notation: AC and ATC both mean average total cost. Total costs are money amounts; average and marginal costs are money per unit. Keep the output interval and time period consistent when calculating ΔTC / ΔQ.
Explain and apply
Mechanism in brief: Adding a variable input to a fixed input can eventually reduce marginal product. With a constant input price, more input is then needed per extra unit of output, raising marginal cost.
Distinguish: Short-run diminishing returns is not diseconomies of scale; LRAC is not tangent to every SRAC minimum.
Use the extract: Identify the fixed input, output period and input-price changes; distinguish diminishing returns from diseconomies of scale.
Deriving short-run cost curves from diminishing marginal productivity
- In the short run, at least one factor of production is fixed (usually capital), so a firm can only raise output by adding more of a variable factor (usually labour) to that fixed factor.
- Diminishing marginal productivity (also called the law of diminishing returns) states that, as successive units of a variable factor are added to a fixed factor, the extra output produced by each additional unit eventually falls.
- The shape of the marginal product curve directly determines the shape of the marginal cost curve, because when workers become less productive, each extra unit of output costs more to produce.
- This is the theoretical foundation for the U-shaped short-run cost curves covered in part c below.
- With the wage rate fixed, MC = wage / marginal product of labour. Rising marginal product lowers MC; once diminishing marginal returns begin, falling marginal product raises MC. Diminishing returns does not require total output to fall.
The law of diminishing returns
- The law of diminishing returns states that if a firm keeps adding units of a variable factor to a fixed factor, eventually the marginal product of each additional unit will be lower than that of the previous unit.
- In other words, past a certain point, an extra worker adds less to total output than the worker before them.
- This is a short-run concept only, since it depends on at least one factor of production being held fixed — in the long run, all factors can vary, so this law does not apply directly.
Cost formulae
- Students must know the following formulae relating total, average and marginal costs.
- Total cost (TC) is the sum of total fixed cost and total variable cost.
- Total fixed costs (TFC) do not change with output in the short run (e.g. rent, insurance).
- Total variable costs (TVC) change with output. TVC = AVC × Q at the specified output; average variable cost need not be constant as output changes.
- Average (total) cost (ATC), average fixed cost (AFC) and average variable cost (AVC) are each the corresponding total cost divided by quantity.
- Marginal cost (MC) is the change in total cost from producing one more unit.
- TFC + TVC → TC ; TC ÷ Q → ATC ; TFC ÷ Q → AFC ; TVC ÷ Q → AVC ; ΔTC ÷ ΔQ → MC
| Cost measure | Formula |
|---|---|
| Total cost (TC) | TFC + TVC |
| Total variable cost (TVC) | Variable cost per unit × quantity |
| Average (total) cost (ATC) | TC ÷ quantity |
| Average fixed cost (AFC) | TFC ÷ quantity |
| Average variable cost (AVC) | TVC ÷ quantity |
| Marginal cost (MC) | ΔTC ÷ ΔQ |
- Diagrammatically, AFC falls continuously as output rises, since a fixed total is spread over more units.
- AVC and ATC are both U-shaped, falling at first as productivity improves and rising once diminishing returns set in.
- The MC curve cuts through both the AVC and ATC curves at their minimum points — whenever MC is below AVC/ATC, the average is being pulled down; whenever MC is above, the average is pulled up.
Figure 3.6 Short-run cost curves
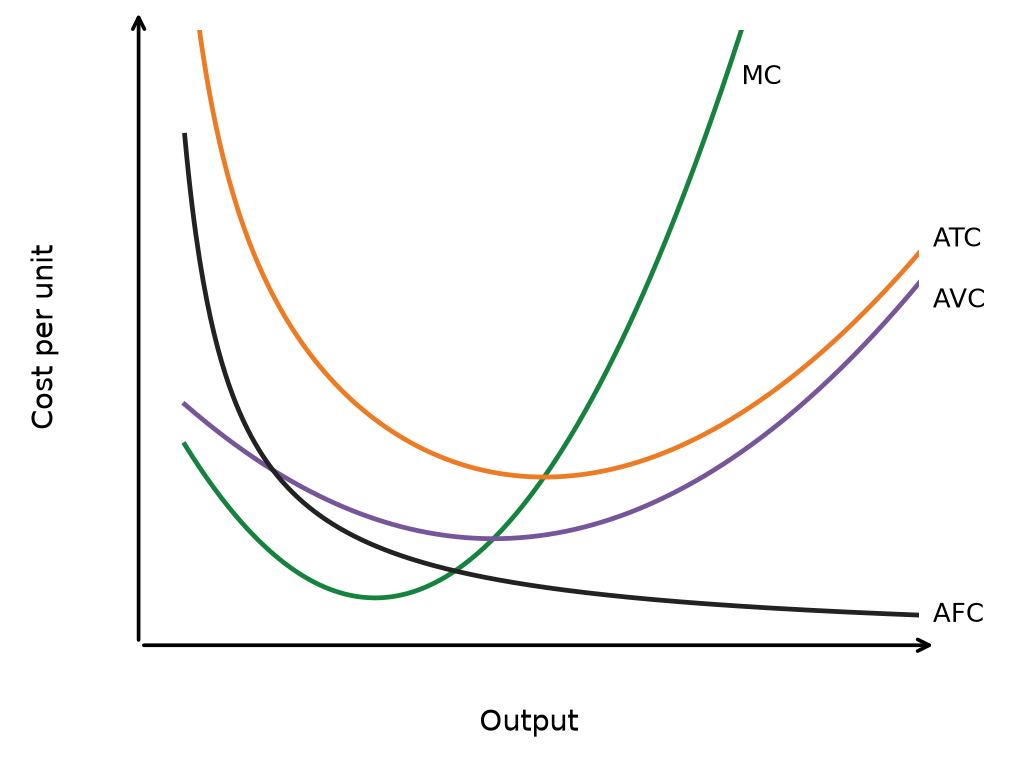
Read the diagram: Follow MC as output rises → where MC is below an average, that average falls → where MC is above it, that average rises. MC crosses AVC and ATC at their minima. ATC − AVC = AFC at each output, and AFC falls as fixed cost is spread across more units.
Assumptions: the short-run illustration holds at least one input fixed and input prices unchanged. AC and ATC are alternative labels for the same average total cost.
Relationships between product, cost, and short-run/long-run costs
- The productivity of the variable factor and the cost of production are two sides of the same relationship:
- when marginal product is rising, marginal cost is falling, and when marginal product is falling, marginal cost is rising.
- With labour as the only variable input and a constant wage, AVC = wage ÷ average product of labour. Thus average product and average variable cost move inversely; do not apply this relationship unconditionally to average total cost, which also includes fixed cost per unit.
- In terms of totals, when total product rises at an increasing rate, total cost rises at a decreasing rate; once total product rises at a decreasing rate (diminishing returns), total cost rises at an increasing rate.
- marginal product ↑ → marginal cost ↓ ; marginal product ↓ → marginal cost ↑
| Product measure | Related cost measure | Relationship |
|---|---|---|
| Marginal product ↑ | Marginal cost | Falls |
| Marginal product ↓ | Marginal cost | Rises |
| Average product ↑ | Average variable cost (constant wage) | Falls |
| Average product ↓ | Average variable cost (constant wage) | Rises |
- In the short run, at least one factor is fixed, so the firm faces the U-shaped cost curves derived above.
- In the long run, all factors of production are variable — the firm can, for example, build a new factory or change its scale of capital entirely.
- The firm will choose, for any given output, the combination of inputs that produces it at the lowest possible average cost.
- The long-run average cost (LRAC) curve is therefore the envelope of all the short-run average cost (SRAC) curves available to the firm, touching each SRAC curve at only one point (the one representing least-cost production for that plant size).
- This LRAC curve underpins economies and diseconomies of scale, covered in the next topic.
Figure 3.7 Long-run cost envelope
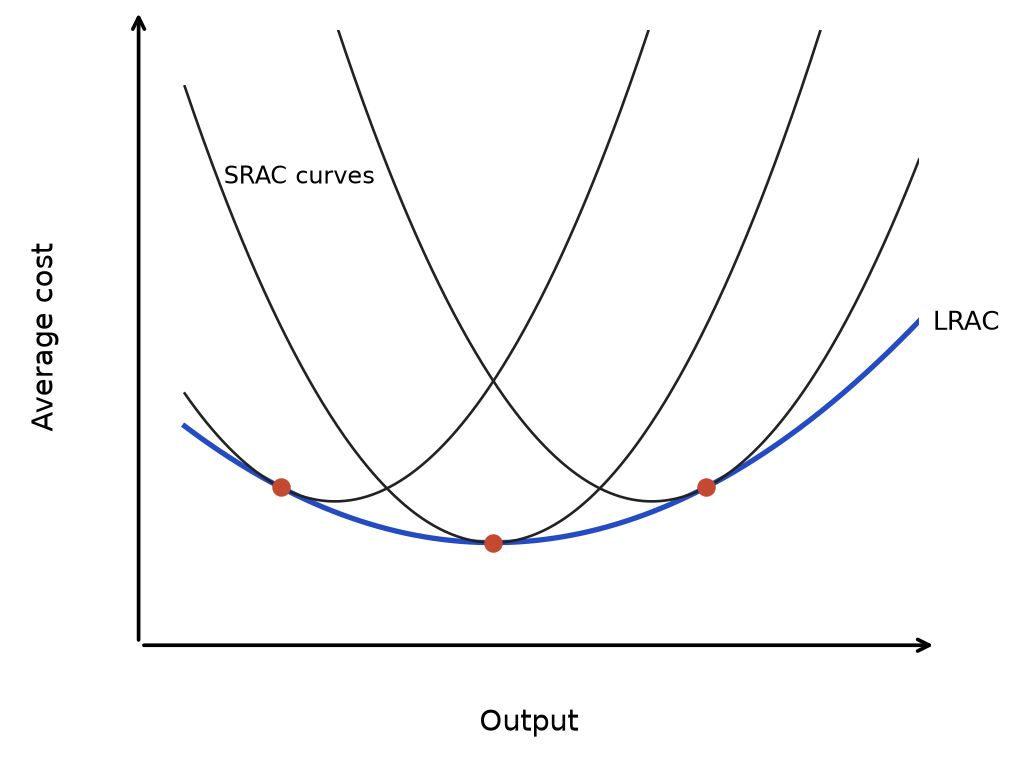
Read the diagram: Each SRAC touches the long-run envelope at the output where that plant is the least-cost choice. The tangency is generally not at the SRAC minimum. Only the central plant has its minimum at minimum LRAC in this smooth illustration.
Cost-curve predictions depend on input prices, technology and the time horizon. A change in average cost is not automatically evidence of scale economies if wages, energy prices or productivity have also changed.
Rapid recap
Calculate: TC = TFC + TVC; AC = TC/Q; AVC = TVC/Q; AFC = TFC/Q; MC = ΔTC/ΔQ.
Explain: MC below an average pulls it down; MC above it pushes it up. In the standard curves, MC crosses AC and AVC at their minima.
Distinguish: diminishing marginal returns concerns extra variable inputs with a fixed factor; economies/diseconomies of scale concern changing all inputs in the long run.
Diagram cue: show MC crossing AC and AVC at their minima; distinguish the LRAC envelope.
Related chapters: Unit 3 chapter 6 (p. 28) · Unit 3 chapter 7 (p. 33)