Total, average and marginal revenue describe different aspects of sales income.
Must know
- TR equals price times quantity.
- AR equals TR divided by quantity.
- MR is the change in TR from an extra unit.
Must know definitions
Total revenue (TR): total income from sales = price × quantity sold.
Average revenue (AR): revenue per unit sold = TR ÷ quantity; identical to the firm's demand curve.
Marginal revenue (MR): extra revenue from selling one more unit = ΔTR ÷ ΔQ.
Price taker: a firm that must accept the market price, facing a horizontal (perfectly elastic) AR = MR = D curve.
Must know relationship: TR = P × Q; AR = TR / Q; MR = ΔTR / ΔQ.
Units: P and AR are money per unit; Q is quantity; TR is money over the stated period. MR uses the change in revenue divided by the change in quantity, not total revenue divided by quantity. Δ means change.
Explain and apply
Mechanism in brief: A price-setting firm lowers price to sell additional units. The reduction affects receipts on earlier units as well, so MR lies below AR; for a price taker, an extra unit earns the unchanged market price.
Distinguish: AR equals price; MR is not generally equal to price.
Use the extract: Use the price and quantity changes to calculate revenue; identify whether the firm faces horizontal or downward-sloping demand.
Total, average and marginal revenue
- Total revenue (TR) is the total income a firm receives from selling its output, calculated as price × quantity sold.
- Average revenue (AR) is revenue per unit sold, calculated as TR ÷ quantity — since AR is simply price per unit, the AR curve is identical to the firm's demand curve.
- Marginal revenue (MR) is the extra revenue earned from selling one more unit, calculated as the change in TR ÷ change in quantity.
- For a price-setting firm, selling more usually requires lowering the uniform price, so MR lies below AR. With a straight-line demand curve, MR has the same vertical intercept and twice its gradient.
- price × quantity = TR → TR ÷ quantity = AR → change in TR ÷ change in quantity = MR
| Measure | Formula | Shape with linear demand |
|---|---|---|
| Total revenue (TR) | Price × quantity | Rises, peaks, then falls as output increases |
| Average revenue (AR) | TR ÷ quantity | Downward-sloping — same as the demand curve |
| Marginal revenue (MR) | ΔTR ÷ ΔQ | Downward-sloping, steeper than AR, cuts the quantity axis where TR is maximised |
- A firm that is a price taker (e.g. under perfect competition) can sell any quantity at the same market price, so its AR curve is horizontal (perfectly elastic).
- Since every extra unit sold earns the same price, MR equals AR at every output — for a price taker, AR = MR = demand (D), all shown as the same horizontal line.
Figure 3.2 Revenue relationships
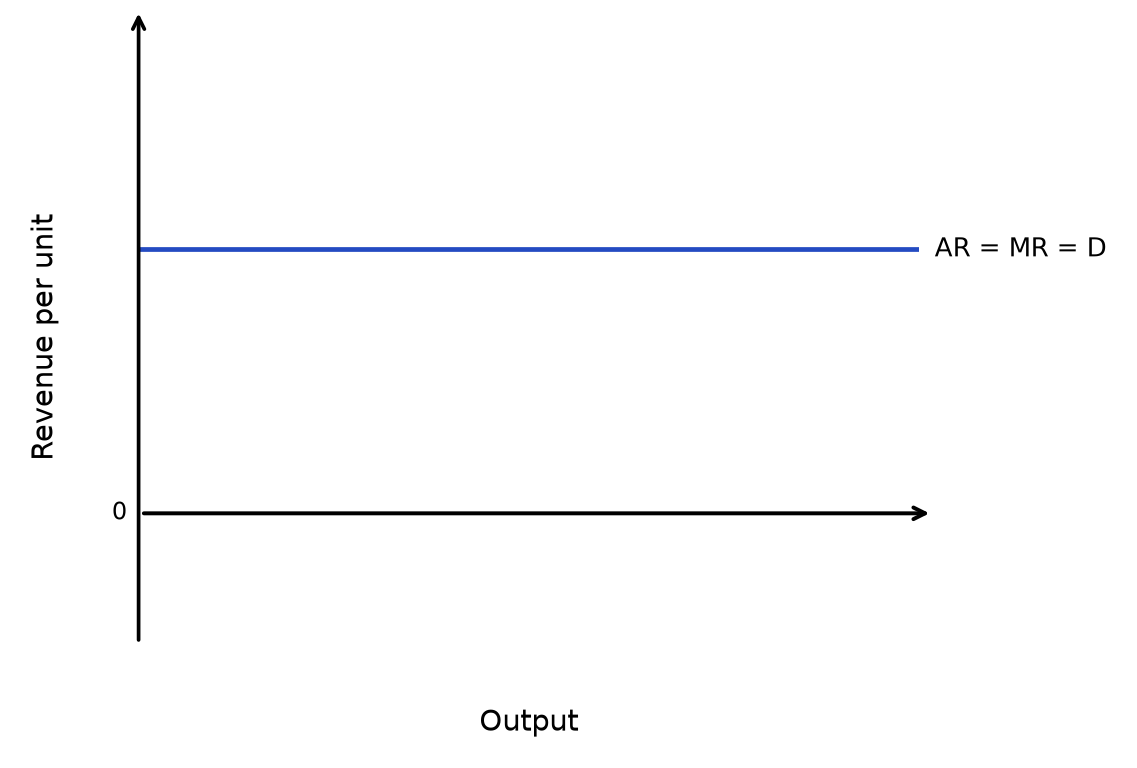
Read the diagram: A price-taking firm receives the same market price for an extra unit. Therefore average and marginal revenue coincide with the horizontal firm demand curve.
Figure 3.3 Revenue relationships
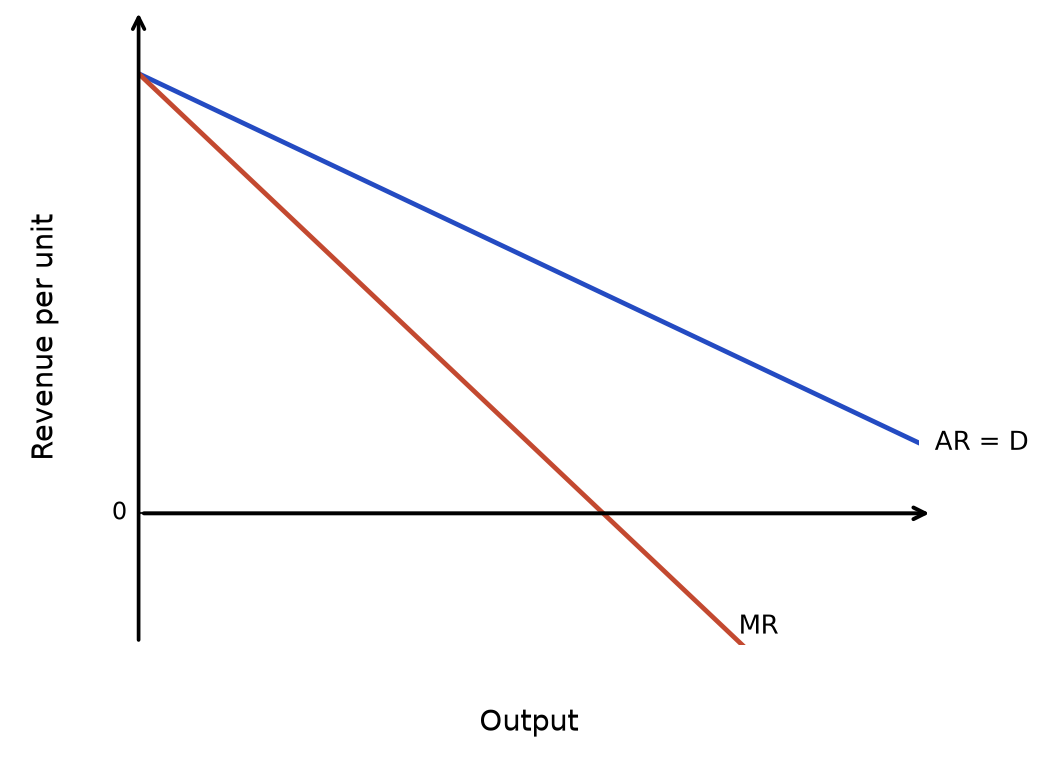
Read the diagram: For a straight-line demand curve, MR has the same vertical intercept and twice the gradient. Selling more requires a price cut on existing units too, so MR lies below AR.
Price elasticity of demand and revenue
- The relationship between price elasticity of demand (PED) and revenue determines how a change in price affects a firm's total revenue.
- When demand is price elastic (PED > 1 in magnitude), a change in price causes total revenue to move in the opposite direction:
- a price rise causes such a large fall in quantity demanded that TR falls, while a price cut raises TR.
- When demand is price inelastic (PED < 1 in magnitude), a change in price causes total revenue to move in the same direction:
- a price rise raises TR because quantity demanded falls only slightly, while a price cut lowers TR.
- Constant unit-elastic demand leaves TR unchanged. A straight demand curve is unit elastic only at its midpoint, where TR is maximised.
| PED | Effect of a price rise on TR | Effect of a price fall on TR |
|---|---|---|
| Elastic (PED > 1) | TR falls | TR rises |
| Inelastic (PED < 1) | TR rises | TR falls |
| Unitary throughout the relevant price range (|PED| = 1) | TR unchanged | TR unchanged |
- On the AR/MR diagram, this relationship has a clear diagrammatic counterpart: along the upper half of a straight-line AR curve demand is elastic, along the lower half demand is inelastic, and exactly at the midpoint — directly above where MR crosses the quantity axis — demand is unitary elastic and TR is maximised.
Figure 3.4 Revenue relationships — panel 1
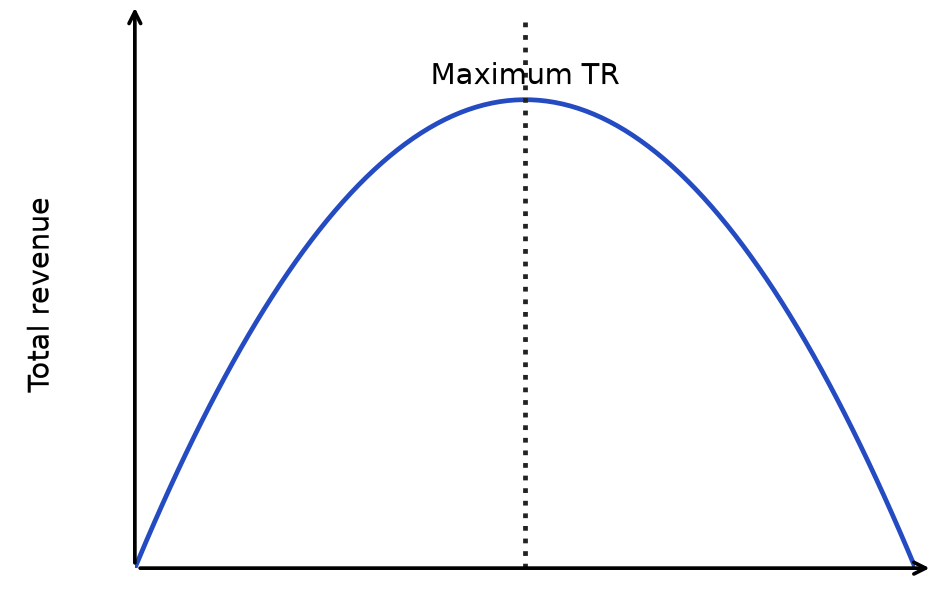
Figure 3.5 Revenue relationships — panel 2
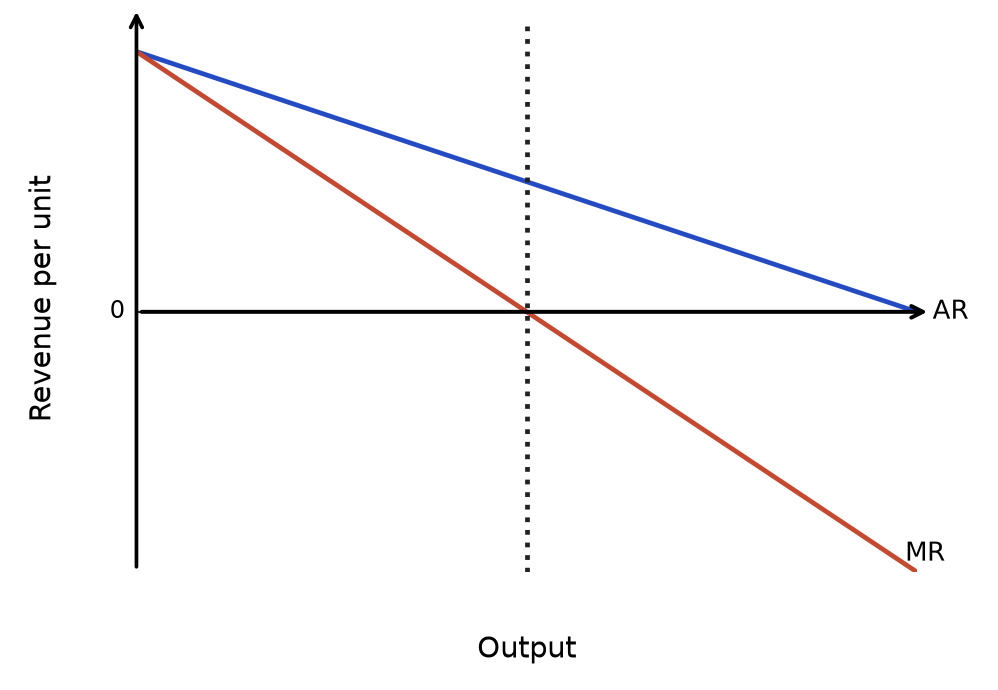
Read the diagram: TR rises while MR is positive and falls when MR is negative. Its maximum is at MR = 0, vertically aligned with the unit-elastic point on the straight AR curve.
A revenue gain is not enough to establish a profit gain. Compare the associated change in cost, and apply elasticity to the relevant price range rather than treating a whole straight demand curve as equally elastic.
Rapid recap
TR = P × Q; AR = TR/Q = P; MR = ΔTR/ΔQ. Revenue peaks where MR changes from positive to negative; maximum revenue need not maximise profit.
Diagram cue: align the TR maximum with MR=0 and explain the AR–MR relationship.
Related chapters: Unit 1 chapter 9 · Unit 3 chapter 3 (p. 13)