Business objectives determine the output choice and the trade-off between price, sales and profit.
Must know
- Profit maximisation uses MC equals MR at the appropriate crossing.
- Revenue maximisation uses MR equals zero.
- Sales maximisation depends on the minimum-profit constraint.
Must know definitions
Profit maximisation: choose the output where MC = MR and MC crosses MR from below; compare this with shutting down where relevant.
Revenue maximisation: producing the output where marginal revenue equals zero (MR = 0).
Sales volume maximisation: choosing the largest feasible quantity. With a break-even constraint, this is the higher-output AR = AC intersection; a positive minimum-profit requirement can reduce the feasible quantity.
Cost-plus pricing: setting price by adding a fixed mark-up to average cost, rather than recalculating MR = MC.
Profit satisficing: seeking an acceptable profit target rather than the greatest possible profit, while pursuing other objectives.
Divorce of ownership from control: the separation between a firm's owners (shareholders) and the managers who run it.
Principal-agent problem: the conflict of interest arising when the principal (shareholder) and agent (manager) have different objectives.
Must know relationship: Profit maximum: MC = MR at the appropriate crossing. Revenue maximum: MR = 0.
Explain and apply
Mechanism in brief: Producing another unit adds MR to revenue and MC to cost. Output should expand while the additional revenue exceeds cost, subject to feasibility; compare the resulting profit with shutdown where relevant.
Distinguish: MR is not the selling price for a price-setting firm; the usual ordering of outputs needs suitable curves and constraints.
Use the extract: Find evidence of a profit target, sales target or managerial incentives; distinguish an observed price from proof of an objective.
Different business objectives
Profit maximisation
Profit maximisation occurs where MR = MC and MC crosses MR from below, so producing further units would add more to cost than revenue. Compare this output with shutdown where relevant.
This is the traditional, neo-classical assumption: shareholders seek to maximise their own utility by maximising the firm's profits, since profit drives the dividends they receive and the underlying share price.
High profits also fund research and development and provide a buffer to survive a downturn.
Illustration: a differentiated producer may restrict output to support margins.
Brand loyalty and limited substitutes can give a firm some pricing power. However, its objective cannot be established from a high price alone.
Evidence on demand, costs and management decisions is needed to judge whether a particular firm is maximising profit.
Not all firms pursue short-run profit maximisation in practice.
Cost-plus pricing
Cost-plus pricing means adding a mark-up to estimated average cost. It may be practical when demand and marginal revenue are uncertain, but it does not guarantee the profit-maximising price.
Cost-plus pricing reduces the need to estimate demand and MR precisely. Its success depends on whether customers will pay the resulting price and whether the estimated average cost reflects actual sales.
A higher mark-up can raise profit per unit but reduce sales; lower output can then raise average fixed cost. A convenient pricing rule is not proof of a profit maximum.
Revenue maximisation
Revenue maximisation occurs at the output where marginal revenue equals zero (MR = 0) — total revenue is at its highest point just before it would start to fall.
Economist William Baumol argued that managers' salary, status, and job security are often linked to the size and growth of the firm's revenue rather than its profit, so maximising revenue better serves managers' own utility than maximising the shareholders' profit.
A fall in revenue, even with profit unchanged, can signal decline to lenders and investors.
Illustration: a platform may prioritise revenue growth and customer acquisition while investors fund early losses.
This may support a long-run strategy, but growing revenue is not proof of revenue maximisation at MR = 0.
Sales volume maximisation
With a break-even constraint, sales volume is maximised at the higher-output AR = AC intersection. If the firm must earn a positive target profit, use that constraint instead.
Firms may pursue this to build the largest possible market share, exploit economies of scale, deter competitors from entering, or drive existing rivals out of the market by pricing below their sustainable level.
An entrant may use low introductory prices to build a customer base. Low prices alone do not establish sales-volume maximisation at AR = AC; evidence on the firm’s costs and objectives is also needed.
In an industry with high fixed costs and spare capacity, attracting more customers can spread fixed costs over additional sales. This is a possible motive for low introductory prices.
Revenue versus sales volume
A common exam confusion: revenue maximisation is not the same as sales volume maximisation.
Revenue maximisation is about maximising the total money taken in (price × quantity); sales volume maximisation is about maximising the number of units sold, subject to at least breaking even.
In the usual diagram with positive marginal costs and a feasible break-even constraint, sales-volume maximisation can produce more output at a lower price than revenue maximisation. The precise ordering depends on the curves and the minimum profit requirement.
Profit satisficing
Behavioural theories, such as satisficing, offer an alternative to strict maximisation.
A profit-satisficing firm meets an acceptable profit target while pursuing other aims, such as staff welfare, revenue growth or service quality. The target does not identify one universal output.
Illustration: owners may accept a lower financial return in exchange for better employee benefits or service quality.
To establish satisficing, identify the profit target and the competing objective; ownership type alone is not proof.
A separation of ownership and control can make satisficing possible when managers meet shareholders’ minimum expectations. The chosen output may lie on either side of the profit maximum, depending on the target and other aims.
Figure 3.1 Business objectives
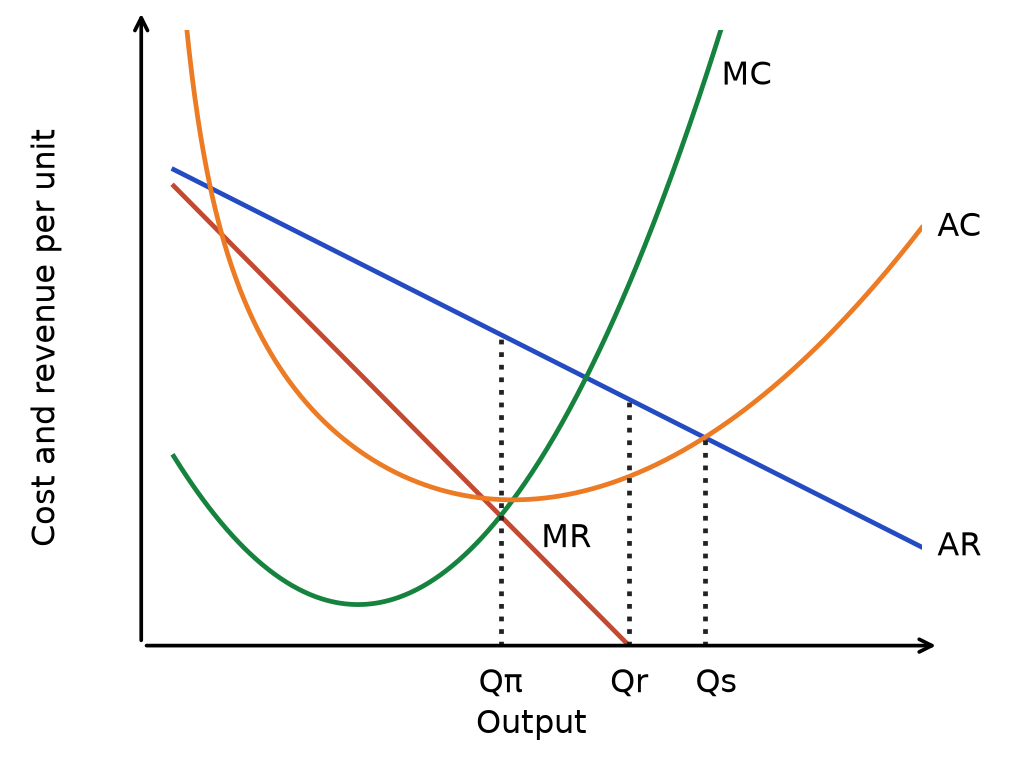
Read the diagram: Find Qπ at the upward MC–MR crossing → find Qr where MR = 0 → find Qs at the higher AR–AC intersection → read each price from AR. Qs assumes a break-even constraint. The illustrated ordering depends on these curves; it is not a universal ordering for every possible firm.
Assumptions: the plotted demand and cost curves are fixed. Qπ, Qr and Qs denote profit-, revenue- and break-even sales-maximising output in this illustration.
| Objective | Decision rule | Output price and profit |
|---|---|---|
| Profit maximisation | MC crosses MR from below | Qπ; read price from AR. Highest attainable profit, which need not be positive. |
| Profit satisficing | An acceptable profit target | No fixed output in this diagram. The chosen price and output must meet the target. |
| Revenue maximisation | MR = 0, if feasible | Qr; price from AR. Revenue is highest; profit depends on AC at Qr. |
| Sales maximisation | Higher AR = AC crossing with a break-even constraint | Qs; price from AR. Normal profit at break-even; a positive profit target lowers feasible sales. |
In this diagram, moving from profit maximisation towards the higher break-even quantity lowers price and raises output. Consumer surplus rises with unchanged demand, while profit falls. Satisficing has no fixed position in this ordering.
Welfare depends on how output compares with the socially efficient level, any external effects and the effect of lower profit on future investment. Higher consumer surplus alone does not settle the overall judgement.
The significance of the divorce of ownership from control: the principal-agent problem
In large firms, especially public limited companies, the people who own the business (shareholders) are usually not the same people who run it day to day (directors and managers) — this separation is known as the divorce of ownership from control.
Shareholders (the principals) want to maximise profit in order to maximise their dividends, but managers (the agents) who actually make operating decisions may have different motives, such as growing sales and revenue, expanding their own department, or maximising personal benefits, even where this comes at the expense of profit.
This conflict of interest is known as the principal-agent problem, and because managers control the firm's day-to-day decisions, it can lead to the business growing larger, or pursuing different objectives, than a purely profit-maximising firm would.
shareholders want profit ↑ (principal) ≠ managers want sales/perks ↑ (agent) → divergent aims → principal-agent problem → firm may grow beyond the profit-maximising size
A common exam point: shareholders cannot perfectly monitor managers' day-to-day decisions (asymmetric information), so managers retain some freedom to pursue their own objectives once shareholders' minimum profit expectations are met (linking back to satisficing behaviour in part a).
Formulae for different business objectives
| Objective | Formula |
|---|---|
| Profit maximisation | MC = MR at the profit-maximising crossing |
| Revenue maximisation | MR = 0, subject to any profit constraint |
| Sales volume maximisation | Higher-output AC = AR, with break-even constraint |
Which objective a firm actually pursues is rarely fixed — it depends on ownership structure, market structure, and the time horizon being considered, and these three factors give the strongest evaluation angles for essay questions comparing business objectives.
Sole proprietors and partnerships, where the owner directly manages the business, face no principal-agent problem and are more likely to pursue profit maximisation directly.
Large Plcs, where ownership is dispersed among many shareholders who cannot closely monitor managers, are more prone to the principal-agent problem, making revenue maximisation or satisficing more likely.
Not-for-profit and public sector organisations may not pursue profit-related objectives at all, instead prioritising a service or social objective (e.g. universal provision, positive externalities) since they do not depend on profit to survive in the way private firms do.
Market structure matters: a differentiated firm such as Ferrari may have pricing power, but that does not make it a monopoly. Sustained supernormal profit depends on barriers to entry and the strength of actual and potential competition.
A firm may accept lower short-run margins to develop market share or scale. Whether this improves long-run profit depends on customer retention, costs and rivals’ responses; it is not a general explanation for every firm.
Finally, the time horizon often resolves the apparent conflict between objectives: many firms that appear to prioritise revenue or sales in the short run (e.g. Amazon's early growth strategy) are still ultimately aiming at long-run profit maximisation — building market share and economies of scale now in order to raise prices or margins once competitors have been deterred.
Short-run sales/revenue maximisation and long-run profit maximisation can therefore be complementary strategies rather than contradictory alternatives, which is a strong evaluative point for essays that ask students to compare or rank business objectives.
Managerial incentives and ownership determine which objective is plausible. A revenue or sales target can raise output but may be constrained by shareholder returns or financial survival; an observed low price alone does not reveal the objective.
Rapid recap
Profit: choose the relevant MR = MC crossing from below, then compare with shutdown where appropriate. Read price from AR and profit from (AR − AC) × Q.
Revenue: MR changes from positive to negative at the TR maximum. Sales volume: choose the greatest output consistent with the stated minimum-profit constraint.
Satisficing: an acceptable profit target leaves room for other objectives; there is no universal diagram point. Use evidence about ownership, incentives and constraints to identify the objective.
Diagram cue: locate profit, revenue and constrained sales objectives; read prices from AR.
Related chapters: Unit 3 chapter 4 (p. 19) · Unit 3 chapter 7 (p. 33)
Why this connects: Revenue identifies what each extra unit earns; cost identifies what it adds to expenditure. Combining them explains the profit-maximising output before price is read from AR.