4.1 Benefits of international trade
International trade is the exchange of goods and services between countries.
Benefits of international trade
1) Benefits to consumers
Trade facilitates specialisation for countries to produce goods they are specialised in. This lowers the costs of production and allows consumers to obtain goods that can be bought cheaper overseas. Trade increases competition between firms. Consumers can enjoy lower prices and more choices for goods and services as they have access to products that are not produced domestically.
2) Benefits to producers
Trade allows domestic firms to access a larger market and expand their production. Firms can enjoy economies of scale (EOS) and lower average production costs. Firms can also achieve greater amounts of specialisation with EOS, allowing them to increase their productivity. Firms can also purchase less expensive raw materials and other inputs to the production process, meaning that their costs of production decrease.
3) The ability to acquire needed resources
Each country is endowed with different kinds of natural resources. Trade allows firms to import capital goods such as machinery that are needed in production, and also to obtain goods that cannot be produced domestically. For example, Singapore imports the majority of its natural resources.
4) A more efficient allocation of resources
With free trade, countries can import goods at lower costs and sell goods to a larger market. Resources can be allocated more efficiently to produce goods that a country is specialised in. That is, the countries that are ‘best’ at producing certain resources will produce them, and will import other goods that they are not as efficient in from other countries.
5) Increased competition
Domestic firms face more competition from overseas firms. This motivates firms to be more productive, efficient and innovative in order to survive in the global market.
6) A source of foreign exchange
Through exports of goods and services, firms earn foreign exchange: when goods are exported, they are paid for in foreign currencies. This, in turn, allows them to purchase imports.
International trade in an exporting country
A country exports a good when domestic production exceeds domestic consumption at the world price. Assume that the country is small, transport costs are ignored and there are no barriers to trade.
Before trade, the domestic market is in equilibrium at price Pe and quantity Qe, where D intersects S. Suppose the world price Pw is higher than Pe. Producers can obtain a higher price by selling abroad, so the domestic price rises to Pw.
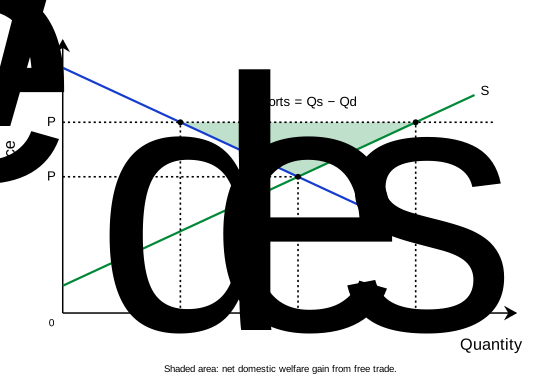
In Figure 4.1A, the higher price causes domestic production to increase to Qs, while domestic consumption falls to Qd. The difference between production and consumption is exported.
Export revenue = Pw × (Qs − Qd)
The effects of opening to trade
Domestic producers gain because they receive a higher price and supply a larger quantity. Domestic consumers lose because the price rises and consumption falls. With no externalities, the increase in producer surplus exceeds the loss of consumer surplus, so domestic welfare increases overall.
For units between Qe and Qs, the export price exceeds the additional cost of domestic production. For units between Qd and Qe, the receipts from exporting exceed the benefit domestic consumers place on those units. The shaded area in Figure 4.1A shows these gains.
Domestic consumer expenditure is PwQd, and total revenue received by domestic producers is PwQs. Their difference is export revenue. No government revenue arises simply from allowing free trade.
Absolute Advantage and Comparative Advantage
The theory of absolute advantage
A country is said to have an absolute advantage in the production of a good if it can produce more of it with the same amount of resources, or if it can produce one unit of it with fewer resources.
Consider the output matrix in Table 4.1.1.1
Table 4.1.1.1 Output matrix of Australia and US (Assume resource level is the same in both countries)
| Country | Textile | Computer |
|---|---|---|
| Australia | 100 | 60 |
| US | 50 | 100 |
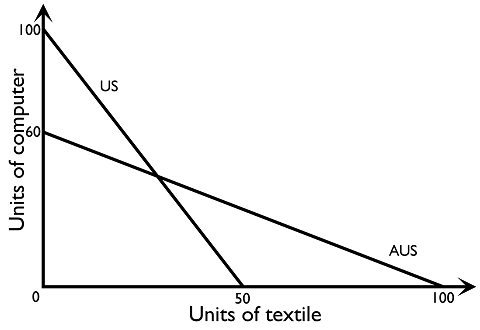
Assume both countries have the same amount of resources. As the US can produce 100 units of computers while Australia can only produce 60 units of computers with the same resources, the US has an absolute advantage in producing computers. Australia can produce 100 units of textiles while the US can only produce 50 units of textiles with the same resources; therefore Australia has the absolute advantage in producing textile.
The idea of the absolute advantage can be graphically illustrated using the PPF diagram. For simplicity, the PPF used here is a straight line. (Figure 4.1.1)
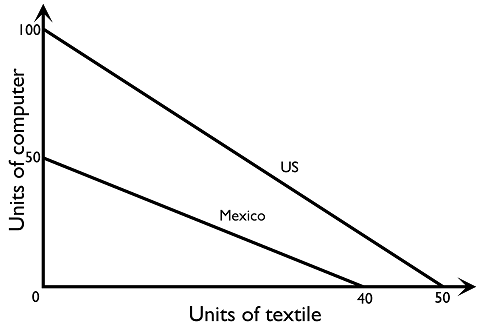
It is possible for some countries to have an absolute advantage on both goods. Consider the output matrix in Table 4.1.2, the US can produce 50 units of textiles while Mexico can produce 40 units of textiles. The US has the absolute advantage in producing textile. At the same time, the US can produce more units of computers using the same amount of resources. The US has the absolute advantage in producing computers.
Table 4.1.2 Output matrix of Mexico and US (Assume resource level is the same in both countries)
| Country | Textile | Computer |
|---|---|---|
| Mexico | 40 | 50 |
| US | 50 | 100 |
In Figure 4.1.3, the PPF of the US obviously lies outward of the PPF of Mexico, and the US has the absolute advantage in producing both computers and textiles.
The theory of comparative advantage
A country is said to have a comparative advantage in the production of a good if the country can produce the good with a lower opportunity cost than another country.
Consider the output matrix in Table 4.1.4
Table 4.1.4 Output matrix of Mexico and the US (Assume resource level is the same in both countries)
| Country | Textile | Computer |
|---|---|---|
| Mexico | 40* | 50* |
| US | 50 | 100 |
When considering the opportunity cost of production, we look at the output data of the same country.
If Mexico produces 40 units of textiles, the opportunity cost is 50 units of computers. The opportunity cost of producing 1 unit of textile is 1.25 units of computers. Alternatively, the opportunity cost of producing 1 unit of the computer is 0.8 units of textiles.
If the US produces 50 units of textiles, the opportunity cost is 100 units of computers. The opportunity cost of producing 1 unit of textile is 2 units of computers. Alternatively, the opportunity cost of producing 1 unit of the computer is 0.5 unit of textiles.
We put the opportunity cost data into the Table 4.1.5 below.
Table 4.1.5 Opportunity cost matrix of Mexico and the US (Opportunity cost of producing 1 unit of output)
| Country | Textile | Computer |
|---|---|---|
| Mexico | 1.25 units of computers | 0.8 unit of textile*
|
| US | 2 units of computers | 0.5 unit of textile* |
When we COMPARE opportunity cost in producing a good, we compare the respective opportunity cost incurred by each country
We say that Mexico has a lower opportunity cost of producing textiles compare to the US, so it has a comparative advantage of producing textiles. The US has a lower cost of producing computers compared to Mexico, so it has a comparative advantage of producing computers.
Refer back to Figure 3.1.2, the opportunity cost of producing the good on the horizontal axis is the slope of the PPF; the country with the flatter PPF has the comparative advantage in producing goods on the horizontal axis, and the other country has the comparative advantage in producing goods on the vertical axis. Since Mexico has a flatter PPF, Mexico has the comparative advantage in producing textiles, while the US has the comparative advantage in producing computers.
Sometimes, the data will be given as the input required to produce one unit of output. Consider the input matrix in Table 4.1.6.
Table 4.1.6 Input matrix of Mexico and US (Assume input required to produce the same level of output)
| Country | Textile | Computer |
|---|---|---|
| Mexico | 5 man hours | 30 man hours
|
| US | 4 man hours* | 10 man hours* |
When we consider the opportunity cost in producing a good, we compare the respective man hours forgone by each country
The US can produce 1 unit of textile using 4 man hours, and Mexico can produce 1 unit of textile using 5 man hours. The US can produce 1 unit of the computer using 10 man hours, and Mexico can produce 1 unit of the computer using 30 man hours. The US has the absolute advantage in producing both textiles and computers as it requires less input per output.
By comparing opportunity cost, we are able to deduce the comparative advantages of each country. If Mexico produces 1 unit of the computer, it will require 30 man-hours; so the opportunity cost is (30/5=6) units of textiles. The opportunity cost of producing 1 unit of the computer is 6 units of textiles. Alternatively, the opportunity cost of producing 1 unit of textile is 0.17 unit of the computer.
If the US produces 1 unit of the computer, it will require 10 man-hours; so the opportunity cost is (10/4=2.5) units of textiles. The opportunity cost of producing 1 unit of the computer is 2.5 units of textiles. Alternatively, the opportunity cost of producing 1 unit of textile is 0.4 unit of the computer.
We put the data into the Table 4.1.7 below.
Table 4.1.7 Opportunity cost matrix of Mexico and US (Opportunity cost of producing 1 unit of output)
| Country | Textile | Computer |
|---|---|---|
| Mexico | 0.17 units of computers | 6 units of textiles*
|
| US | 0.4 units of computers | 2.5 units of textiles* |
When we COMPARE the opportunity cost in producing a good, we compare the respective opportunity cost incurred by each country
We say that Mexico has a lower opportunity cost of producing textiles compared to the US; it has a comparative advantage of producing textiles. The US has a lower opportunity cost of producing computers compared to Mexico; it has a comparative advantage of producing computers.
Consumption possibilities and gains from trade
A country's PPC shows the combinations of goods it can produce using its available resources and technology. Without trade, consumption is limited by domestic production. With trade, a country can exchange part of its output for goods produced abroad.
Assume that Country A has a comparative advantage in good X and Country B has a comparative advantage in good Y. Opportunity costs are constant. Country A specialises in X and produces at point S in Figure 4.1B.
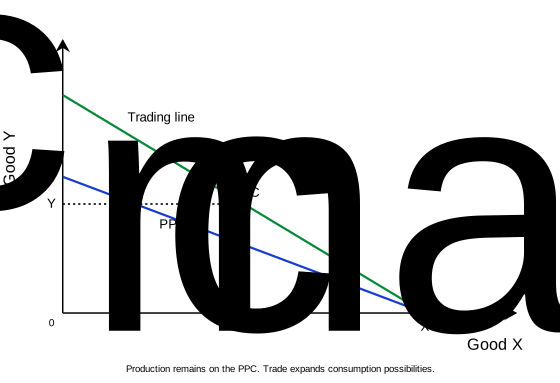
The trading line through S shows the combinations of X and Y that Country A can consume by exchanging X for Y. Its slope depends on the rate at which the goods are exchanged. If each unit of X exported buys more Y than Country A sacrifices to produce that unit, trading gives Country A access to consumption combinations outside its PPC.
At C, Country A retains Xc for domestic consumption and exports Xmax − Xc. In return, it imports Yc. Point C lies beyond the PPC. The country has not increased its productive capacity; it is consuming a combination it could not produce by itself.
The rate of exchange between the goods
For both countries to have an incentive to trade, the amount of Y exchanged for one unit of X must lie between their opportunity costs of producing X.
Country A then receives more Y by producing X and trading than by producing Y directly. Country B gives up less Y to obtain X through trade than it would sacrifice by producing X itself. If the exchange rate equals one country's opportunity cost, that country has no strict gain from the exchange.
The diagram shows potential gains from trade. It does not show how those gains are distributed within each country. It also assumes that resources can move into the industries in which each country specialises.
Trade Pattern
Ricardo suggests that countries should focus on producing goods with comparative advantage, and trade for goods of comparative disadvantage.
Following what Ricardo suggests, Mexico should specialise in producing textiles and import computers, while the US should specialise in producing computers and import textiles.
Note that when the PPFs drawn for the two countries are parallel, the opportunity cost for both countries of producing computers and textiles are the same. Neither country has the comparative advantage of producing computers nor textiles. There is no room for specialisation and mutually beneficial trade.
Sources of comparative advantage
1) Difference between countries in factor endowment (Same productivity of input, different factor endowment)
Countries are endowed with different quantities of natural capital and human resources, and this will affect the labour and capital ratio. Countries with a relatively high labour-capital ratio may have a comparative advantage in producing labour-intensive goods.
2) Difference between countries in the levels of technology (Same factor endowment, different productivity of input)
Levels of technology affect the quality of factors of production. It may improve the productivity of labour and capital. Countries with a higher level of technology may be more likely to have a comparative advantage in producing manufactured or highly innovative goods.
Comparative advantage is a dynamic concept that changes over time due to factors like government intervention.
Assumptions of the principle of the comparative advantage model
1) A constant opportunity cost of production reflected in the linear PPFs means factors are perfectly mobile across industries
2) Labour is regarded as the sole factors of production
3) Free trade is available where there are no protectionist measures imposed on goods and services
4) Perfect mobility of factors of production in the production of goods and services
Limitations of the principle of comparative advantage
1) Assumptions do not accurately reflect real-world conditions
Besides labour costs, transport costs and trade barriers exist that may prevent trade flow and distort the trade pattern. E.g. if transport costs are too high, countries might be better off producing the goods and services domestically.
2) Benefits of specialisation
If countries specialise in production, they can increase output levels, enjoy economies of scale, and lower the average cost through specialisation. Though opportunity cost is not a constant in this case, the prediction of the theory of comparative advantage still holds.
3) Costs of specialisation
Labour may be occupationally and geographically immobile between countries that may affect the production cost. Adjustment costs exist which reduce the benefits of specialisation. Overspecialisation in a country’s comparative advantage may cause unemployment in certain regions and sectors. The theory of comparative advantage is still useful in understanding and explaining trade flows across the globe despite its limitations.