3.7 Supply-side policies
Supply-side policies aim at positively affecting the production side of the economy. There are two types of supply-side policies: interventionist and market-based.
The goals of supply-side policies
The goals of supply-side policies are:
- Achieving long-term economic growth by increasing the productive capacity of the economy.
- Improving competition and efficiency.
- Reducing labour costs and unemployment through increased labour market flexibility.
- Reducing inflation to improve international competitiveness.
- Increasing firms’ incentives to invest in innovation by reducing costs.
Market-based supply-side policies
Market-based supply-side policies means the government aims to reduce its role in the working of markets, and let markets operate with the least restrictions to improve total productive capacity.
The policies include:
(1) Competition-encouraging policies
a) Deregulation
Deregulation means the government reduces regulatory constraints in the market. The government might introduce more competition to different sectors using deregulation, that is, the removal of restrictions on entry or operations in specific markets. This may decrease business’ costs of production as they will have fewer costs associated with complying with government regulation, such as environmental laws or health and safety regulations.
For example, until 2006 the Royal Mail was the only company allowed to deliver letters and parcels in the UK. This deregulation of the market encouraged more firms to enter to provide competing services, therefore encouraging Royal Mail to improve its efficiency.
In Singapore in 2018, productivity in the service sector grew by just 2.2%, compared to a growth of 9.8% in the manufacturing sector. The government has therefore decided to deregulate a range of service markets to open the sector up to greater competition and encourage innovation and productivity growth.
Singapore introduced the National Electricity Market of Singapore (NEMS) in 2003 to promote competition, efficiency and private investment, and progressively opened retail electricity supply to competition. By 2018, EMA reported that over 60,000 business accounts had switched to buying electricity from retailers, representing 79% of total electricity demand; this was a share of demand, not of consumers. Separately, EMA’s 2014–15 annual report recorded a 30% fall in wholesale electricity prices in 2014 compared with 2013, alongside additional generating capacity and lower gas prices. The fall cannot be attributed solely to liberalisation, and wholesale prices are not the same as household electricity bills. Source: EMA annual report 2014–15
The government has also deregulated the telecommunications market, with Singapore Telecom (SingTel) losing its monopoly on fixed-line services, meaning that it now faces tough competition. Furthermore, foreign firms are now also allowed to enter the country to compete with domestic firms, further encouraging competition. This has had the effect of reducing SingTel’s profits, and reducing prices for consumers.
b) Privatisation
The government may choose to privatise state-owned enterprises, and let private operators run the companies. Free-market economists argue that privately-owned, profit-maximising firms will be more efficient than nationalised firms and therefore increase the potential output of the economy.
For example, in the 1980s and 1990s the UK privatised many industries such as British Power, British Telecom and British Airways.
Between 1994 and 1997, the British government privatised British Rail, the UK’s railway system, in order to promote efficiency by creating more competition. This is a historical account of the 1994–1997 privatisation. Infrastructure and train operations should be distinguished: Network Rail was reclassified to the public sector from 1 September 2014.
The Railways Act (1993) led to the sale of infrastructure to Railtrack, and maintenance assets to 13 different companies. The passenger trains were sold to three rolling stock companies, who lease trains out to train operating companies. The operating companies are granted contracts to operate on different areas of the rail network.
The success of this privatisation has been debated.
- Although the number of rail journeys has increased, this may be due to factors like road congestion and rising fuel prices rather than due to privatisation.
- Since privatisation, standard single fares have increased by up to 208%, whereas the price of Advance tickets has decreased from an average of £9.14 in 1995 to £5.17 in 2014 (in 2014 prices).
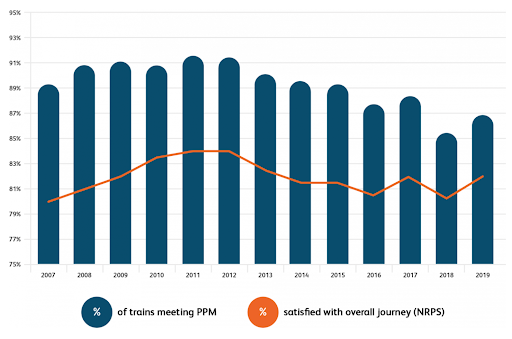
- The Public Performance Measure is the percentage of trains which arrive at their destination ‘on time’, in comparison to the total number of arrivals planned. A train is ‘on time’ if it arrives within five minutes of its planned arrival time for short-distance services, or within ten minutes for long-distance services. The graph below shows the PPM over time; in 2020, the national PPM is 96.0%. The graph also shows the proportion of people who are satisfied with their journeys, using a survey of 50,000 passengers a year. This level of satisfaction was around 83% in 2019.
https://www.networkrail.co.uk/who-we-are/how-we-work/performance/ railway-performance/public-performance-measure-and-delay-responsibility/
- Andrew Evans’s 2007 study examined British railway safety using accident data from 1967 to 2003 and comparisons with historical trends. It found no evidence that privatisation had caused safety to deteriorate. This does not establish a precise number of lives saved by private rather than public ownership. The international comparison in the graph below provides further context, but cannot by itself identify the effect of privatisation. Source: Evans, Rail safety and rail privatisation in Britain (2007)

https://www.era.europa.eu/sites/default/files/library/docs/safety_interoperability_
progress_reports/ railway_safety_and_interoperability_in_eu_2018_en.pdf
- Investment has also increased since privatisation, from £698 million in 1994-95 to £6.84 billion in 2013-14.
- There have also been efficiency gains since privatisation. Since 1997-98, the operating costs of train companies per passenger mile have been reduced by 20% in real terms.
- However, although privatisation was intended to encourage competition between privately owned companies, most of the franchises have ended up being owned by a few dominant transport groups, including Abellio, Arriva, FirstGroup, and National Express.
c) Trade liberalisation
Another way for the government to encourage competition is through the introduction of foreign competition by reducing subsidies, tariffs and quotas. This means that domestic firms will need to become more efficient in order to compete with foreign firms.
For example, many developing countries, such as Ethiopia, have been liberalising trade in order to provide firms with access to cheaper and better quality inputs, therefore boosting productivity and improving product quality.
In 1992, Canada, Mexico and the United States signed the North American Free Trade Agreement (NAFTA), creating one of the largest trade blocs in the world. Under NAFTA, barriers to trade between the three countries were either reduced or eliminated.
NAFTA entered into force on 1 January 1994. It was replaced by the US–Mexico–Canada Agreement (USMCA) on 1 July 2020. The trade figures that follow describe the NAFTA period.
Since NAFTA was passed, trade between the US, Canada, and Mexico, has increased, from around $290 billion in 1993 to over $1.1 trillion in 2016, as has cross-border investment; for example, US Foreign Direct Investment (FDI) in Mexico rose from $15 billion in 1993 to around $108 billion in 2014.
In the US, NAFTA has led to the creation of jobs, with around 6 million US jobs depending on trade with Mexico according to the US Chamber of Commerce. Trade between the US and Mexico was around $500 billion in 2015, meaning that Mexico imported more from the US than Brazil, Russia, India, and China combined; this is in part due to the low or non-existent tariffs between the countries.
d) Anti-monopoly regulation
Anti-monopoly laws encourage competition, and therefore lead to greater efficiency.
For example, Article 82 of the EU Treaty prevents monopolies from taking advantage of their position by banning companies from limiting production so that consumers are disadvantaged, treating other businesses unequally to put them at a disadvantage, or setting unfair prices.
(2) Labour market reforms
a) Reducing the power of labour unions
Trade unions are responsible for protecting workers’ well-being and incomes; it is arguable that unions raise the cost of workers above the level that would prevail in a non-union environment. Reducing union power would reduce workers’ collective bargaining power and therefore reduce labour costs.
In the UK, trade union powers were weakened under Prime Minister Margaret Thatcher in the 1980s. Thatcher considered the unions to be an obstacle to economic growth; she therefore passed legislation to limit the effectiveness of unions, for example by making it more difficult to strike legally.
This contributed to a reduction in trade union membership in the 1980s and 1990s. Membership fell from around 13 million in 1979 to around 7.3 million in 2000, and in 2012 dropped below 6 million for the first time since the 1940s. In 2018, only around 20% of UK workers were members of a trade union.
In a 2018 speech, Bank of England economist Andy Haldane used a long-run wage equation to estimate that declining unionisation had reduced annual wage growth by around 0.75 percentage points over the preceding three decades. This is an attributed model estimate, not a 0.75% annual fall in wages. The result suggests that bargaining power can matter for wage growth, but does not establish that any future fall in union membership must produce the same effect. Source: Bank of England, Pay Power (2018), p.11
b) Reducing unemployment benefits
Generous unemployment benefits might decrease the incentive that unemployed people have to find a job.
For example, in 2020, people who are single and aged 25 or over can claim £409.89 in unemployment benefits per month. Given that the UK’s national minimum wage is £8.72 an hour, and people earning minimum wage would have to work around 47 hours a month to make the same amount as the unemployment benefit, the existence of the benefit might disincentive working.
Historical comparison, 2020/21: £409.89 ÷ £8.72 per hour ≈ 47 hours per month, or about 10.8 hours per week averaged over a year. This compares gross wages with the standard allowance only; it does not calculate a claimant’s net gain from work, which depends on benefit withdrawal and household circumstances.
In 2019, the French government reformed its unemployment benefits system in order to make it more difficult for the unemployed to claim benefits, and therefore to encourage people to get back to work more quickly.
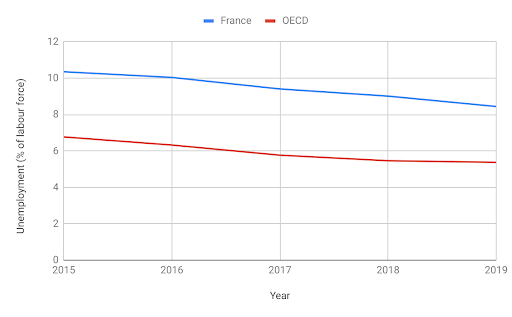
The graph below compares France’s unemployment rate to the OECD average. It shows that France’s unemployment rate, while lower in 2019 than it was in 2015, is still persistently above the OECD average.
The new regulations on unemployment benefits will:
- Increase the amount of time that people have to work in order to be entitled to unemployment benefits.
- Reduce the benefits that wealthier workers get after six months of unemployment by 30%.
The government estimated that these measures would save €3.4 billion euros over three years.
c) Reducing or eliminating the minimum wage
The minimum wage keeps the price of labour above its free-market level; reducing or abolishing the minimum wage would therefore decrease the cost of labour and increase aggregate supply.
For example, the UK minimum wage rate increased in 2020 from £8.21 per hour to £8.72 an hour for those aged 25 and over. This may increase firms’ costs of labour, and have a depressive effect on aggregate supply.
(3) Incentive-related policies
a) Personal income tax cuts
Reducing personal income taxes increases people’s incentive to work, as they will be able to retain more of the income they get from working harder and earning more money.
For example, in April 2020 the UK raised the threshold for National Insurance contributions, that is, the level at which taxpayers start to pay National Insurance contributions, to £9,500. This means that consumers are able to keep more income before they have to start paying tax.
In its 2019-20 budget, the Australian government announced plans to lower income taxes in order to strengthen the economy by encouraging consumption growth and to make the tax system more progressive.
The original plan announced in 2019 had three stages:
- In 2018-19, the government reduced taxes for low- and middle-income earners to reduce pressure on costs of living and promote consumption. This reduction was up to $1,080 for single earners, or up to $2,160 for dual-income families.
- The original plan scheduled an increase in the top threshold of the 19% bracket to $45,000 and in the low-income tax offset to $700 for 2022/23. These measures were subsequently brought forward to 2020/21.
- The original third stage proposed reducing the 32.5% rate to 30% from 2024/25. Before implementation, the package was redesigned: from 1 July 2024, the 19% rate became 16%, the 32.5% rate became 30%, and the thresholds for the 37% and 45% brackets became $135,000 and $190,000 respectively.
Under the original proposal, the Australian government predicted that the plan will increase the number of people paying a 30% tax rate from around 47% of the population to around 70% of the population, and the number of people paying a 19% tax rate from 16% of the population to 24% of the population.
Those percentages were projections for the original plan, not the distribution under the redesigned 2024 tax cuts. Australian Treasury: tax cuts
b) Cuts in business tax and capital gains tax
Allowing businesses to keep more of their profits means that they will have more money available for investment; more investment leads to higher productivity. Firms may also use funds for research and development, leading to advances in technology. Lower taxes will also incentivise the firm to perform more efficiently as it knows that it will be able to keep a greater proportion of any cost-savings that it is able to make.
For example, the corporate tax rate in America was dropped from 35% to 21% in 2018. This increased businesses’ net profits.
The United States Tax Cuts and Jobs Act of 2017 reduced the corporate tax rate from 35% to 21%, creating a new single tax rate and removing the corporate alternative minimum tax (AMT). The AMT operated alongside the corporate income tax; under it, every firm had to calculate its tax burden under both the regular corporate income tax and the AMT, and pay whichever was higher.
The federal tax cut from 35% to 21% meant that, combined with state and local taxes, the statutory rate that firms will be paying is now around 26.5%.
Supporters of the corporate tax rate cut argued that it would increase the long-run size of the US economy by 1.7%, resulting in higher wages, a larger capital stock, and 339,000 additional jobs in the long-run. They also argued that the reduction would increase average household income in the US by leading to higher investment, and therefore to higher real wages.
In response, opponents of the tax cut have noted that it has had large short-term impacts on the budget deficit. From 2017 to 2018, the federal budget deficit increased by $113 billion, with around 80% of this increase being due to the fall in corporate tax receipts.
The cut on business and capital gain taxes may look similar to industrial policies, which are interventionist policies. The difference is the motivation the government has in mind; interventionist industrial policies aim to promote the growth of specific sectors, while supply-side incentive-related policies aim to increase overall investment without regard to the areas where this may occur.
Evaluation of market-based supply side policies
Constraints on market-based supply side policies
(1) Effect on environment
Deregulation can also have an adverse effect on the environment, which can be in conflict with commercial interests. These can be understood as negative externalities inflicted by increased economic activity.
(2) Effect on equity
Unemployment benefits and minimum wage provide a safety net to lower-income households. Cutting these will adversely affect their welfare and equity. In addition, income tax cuts often disproportionately benefit the wealthy, as they often have more to gain from tax cuts (low-income earning individuals may not pay taxes in the first place), and has an adverse effect on equity.
(3) Time lags
All supply-side policies will have a time lag before the effect is felt. For example, the effect of an increased investment in education will only be felt once those who benefit from that education enter the workforce.
(4) Vested interests
Privatisation may not have positive results if it is not carried out transparently; for example, nationalised industries have at times been sold at prices below their true value to individuals with connections to the government.
Strengths of market-based supply-side policies
(1) Ability to reduce inflationary pressure
By curbing the power of labour unions, the increase in labour wages can be slowed down, which in turn reduces inflationary pressure on the economy.
(2) Increased competition and efficiency
Many state-owned enterprises’ efficiency is below the efficiency of private operations due to the lack of (or diminished) profit-motive to keep costs down. Increased competition can also encourage innovation to decrease costs and allocate resources more efficiently.
(3) Possible budget advantages
Some market-based policies, such as deregulation, may require less direct government spending than interventionist measures. However, they are not necessarily budget-neutral. Tax cuts can reduce revenue, and regulation, enforcement or restructuring may involve public expenditure. Their fiscal effect depends on the policy and its wider effects on economic activity.
Interventionist supply-side policies
Interventionist supply-side policies means the government directly participates in improving the quality and quantity of factors of production to improve total productive capacity.
The policies include:
(1) Investment in human capital
The government can invest in education and training and raise the productivity level of its workers. For instance, Singapore has focused on developing its human capital from its establishment, through mandatory education and incentives for firms to train their employees.
Many countries have compulsory education policies in order to develop their human capital. In the UK, for example, full-time education is compulsory for all children between the ages of 5 and 16, with compulsory education or training until 18 in England.
In England, children can leave school when they are 16, but must then either stay in full-time education, for example at a college, start an apprenticeship or traineeship, or spend at least 20 hours a week working or volunteering while in part-time education or training. In 2016-17, 86% of pupils were still in education after the age of 16.
(2) Investment in new technology
The government can have policies to encourage research and development or to directly invest in new technology. During the Cold War era in the 1960s, the US invested heavily in space technology as it was falling behind the Soviet Union. Due to government policy, there was a rapid development in aerospace technology in that period.
In 2017, the German government invested €800 million into energy efficiency and renewables research, focussing specifically on projects aimed at better integrating renewable energy into the existing energy system.
In 2010, the German government set a goal of generating 80% of the country’s electricity from renewable sources by 2050. Until 2011, Germany obtained around 25% of its electricity from nuclear energy; however, this began to be phased out in 2011, with eight of the 17 reactors being shut down immediately. Since then, the focus shifted to renewable energy, with government funding allowing for a boom in manufacturing capacity and innovation. For example, between 2000 and 2013, Germany was third in the world in terms of patent filings for renewable energy technology.
Between 2019 and 2025, the German government has also pledged to invest €400 million in developing energy storage, a new power network designed around renewables, adapting industrial processes to fluctuating renewable sources, and integrating conventional and renewable production.
(3) Investment in infrastructure
Infrastructure includes essential facilities and services such as roads, airports, and sewage treatment that add to the capital stock of the economy and are necessary for economic activities. For instance, the heavy investment in high-speed broadband networks during the dot-com bubble in the early 2000s has provided the infrastructure necessary for data-heavy internet uses today, such as video sharing and cloud computing.
Singapore’s government’s high levels of investment in infrastructure means that the country’s infrastructure is among the best in the world. The government has a number of significant infrastructure projects planned in the near future, for example:
- It aims to increase the length of the country’s railway network, with the aim that eight out of ten households will be within a ten-minute walk from a train station by 2030.
- The plan described in the original case was to build a new terminal at Changi International Airport which was expected to increase the airport’s capacity from 85 million passengers per year in 2018 to 135 million per year by 2030. The original case projected a cost of around $10 billion US dollars, with the government funding around 70% of the project and the remainder funded by the Changi Airport Group.
- Water infrastructure provides another example. PUB’s estimate for Phase 2 of the Deep Tunnel Sewerage System was S$6.5 billion for the whole project. Contemporary reporting in 2019 expressed this as approximately US$4.8 billion; it was an estimated project cost, not annual spending. Sources: PUB industry briefing; Contemporary project report
Updated timetable: Changi Airport Group now schedules Terminal 5 to open in the mid-2030s, with its first phase able to handle around 50 million passengers annually. The 2030 opening date and the total-capacity comparison above belong to the earlier plan. Changi Airport Group: Terminal 5
In August 2019, GlobalData forecast that spending on the infrastructure projects it tracked could reach US$10.7 billion in 2021 if all projects proceeded as planned. The pipeline included both publicly and privately funded projects. This was a conditional forecast, rather than a record of actual government expenditure in 2021. Source: Southeast Asia Construction, 19 August 2019
(4) Industrial policies
The government may use targeted industrial policies to promote growth in key areas of the economy, through the use of tax allowances, or subsidised lending programmes. For instance, Korea and Taiwan have used active government support and directives in strategic industries (such as shipbuilding and microchip manufacturing) to drive economic growth. The Hong Kong government has offered incentives e.g. rental subsidy to IT startups.
In 2015, the Chinese government launched its ‘Made in China 2025’ scheme, which aimed to help the country move away from producing cheap, low-quality goods, and towards the production of higher-value products and services. It set a target of achieving domestic supply of 70% of core basic components and key basic materials by 2025. This was a target, not evidence that it was achieved. The scheme focused on a number of key industries; these included:
- Information technology
- Robotics
- Green energy and green vehicles
- Aerospace equipment
- Ocean engineering
- Railway equipment
- Power equipment
- New materials
- Medicine and medical devices
- Agriculture machinery.
Government guidance funds are one means of financing priority industries in China. They combine government backing with contributions from other investors to support selected firms and projects. Announced fund targets, capital actually raised and amounts invested are different measures; the total size of these funds should not be treated as government expenditure on Made in China 2025. Source: Original research, The China Quarterly
(5) Improving quality, quantity and access to health care
Improving the quality and quantity of and access to health care would also improve human capital by improving productivity while workers are at work and reducing the amount of time that workers have to take off due to ill health. For example, the UK’s National Health Service provides high-quality healthcare that is free at the point of delivery.
In 2019, the UK government announced a £135 million investment in research in health and social care, aiming to tackle significant issues in healthcare such as dementia, mental health, and obesity. This investment was spent on:
- £69.5 million on the Nucleic Acid Therapy Accelerator, the Advanced Pain Discovery Platform, the UK Centre of Evidence Implementation in Adult Social Care and to tackle multi-morbidity
- £50 million for NHS Diagnostic Services and to support Centres of Excellence to further developments in artificial intelligence and digital pathology
- £14 million for bioscience projects and technologies, which will help to develop vaccines and treat osteoarthritis
Through these investments, the UK government is hoping to ensure the ongoing efficiency of the NHS as it deals with the challenges of supporting the elderly, and achieving the goals set out in the NHS Long Term Plan, including achieving efficiencies and improving preventative care and public health.
Evaluation of interventionist supply side policies
Weaknesses of interventionist supply-side policies
(1) Impact on government budget
Interventionist policies involve higher government spending, which has an impact on the government budget. Increased government spending has to come from increased taxes, selling of state-owned enterprises, or raising debts.
(2) Time lag
It takes time to implement interventionist supply-side policies, and it also takes time for the policies’ effects to be fully realised. e.g. the provision of more and better healthcare services involves the construction of hospitals and hiring of doctors. The benefits to society might only be realised after several years.
Strengths of interventionist supply-side policies
(1) Addressing market failure resulting from positive externalities
Certain types of investment (such as education and infrastructure) have large positive externalities and would be underprovided under a market system. Government involvement addresses the underprovision of these investments.
(2) Creation of employment
As noted above, most forms of interventionist policies have an element of increased government spending. This has both the effects creating employment during the use of the policy (e.g. jobs provided by construction projects) and after the implementation of the policy (e.g. increased business demand with better road connections).
(3) Impact on economic growth
Investment in factors of production is essential for sustained growth in the long-term. Policies that directly increase such investment, or encourage private investment, have a positive impact on economic growth.
Demand-side effects of supply-side policies
Some supply-side policies will have short-run demand-side effects as well as long-run supply-side effects.
Market-based policies like reducing taxes will have expansionary fiscal effects; for example, when taxes are reduced, consumers and businesses have more disposable income available. Consumers will therefore increase their consumption, and businesses will increase their investment; this will boost economic growth and lower unemployment, but may lead to inflation.
Interventionist policies will also impact aggregate demand as they involve government spending. They will therefore lead to short-term economic growth, but may also raise inflation.
Diagrams for supply-side policies
Productive capacity and aggregate supply
Successful supply-side policies increase the economy's ability to produce goods and services. In Figure 3.7A, an improvement in productivity shifts LRAS from LRAS₁ to LRAS₂. Where the improvement also lowers firms' unit costs, SRAS shifts from SRAS₁ to SRAS₂. With AD held constant, real output rises and the price level falls in the new equilibrium shown.
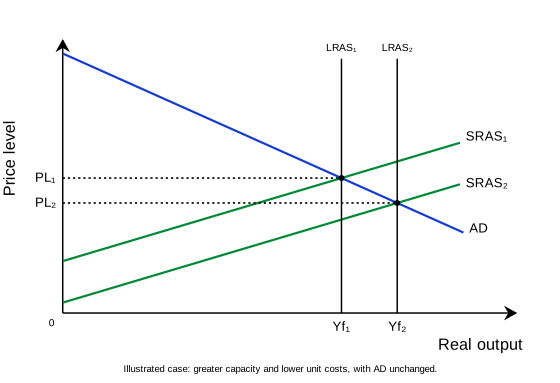
This result depends on the policy improving capacity or productivity. Announcing higher expenditure on training does not immediately shift LRAS. The effect occurs as workers acquire useful skills and these skills are used in production.
Supply-side policies may also affect demand. Government purchases associated with an infrastructure programme can raise AD before the completed infrastructure increases capacity. The initial effect may therefore be higher output and prices, while the longer-term supply effect develops later. The final price-level change depends on the relative shifts in demand and supply.
Minimum wages and labour market flexibility
Figure 3.7B assumes a competitive labour market. A binding minimum wage Wmin is above the market-clearing wage We. Firms demand Ld workers while Ls workers are willing to work. The difference is excess supply of labour.
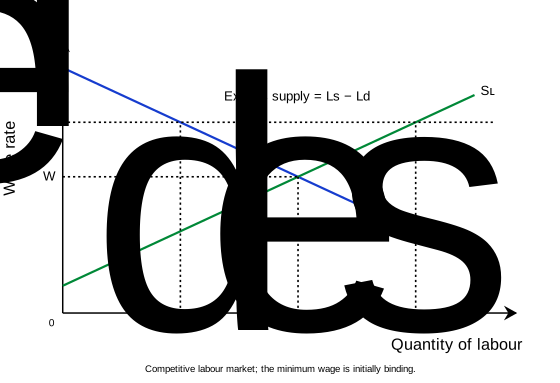
Removing the minimum wage allows the wage to fall towards We in this model. Employment rises from Ld to Le. The quantity of labour supplied also falls from Ls to Le, so the removal of excess supply is not entirely an increase in employment.
Workers who gain jobs benefit, but workers previously employed at Wmin may receive a lower hourly wage. The distributional effect therefore matters. This competitive-market result should not be applied automatically to a labour market in which employers have wage-setting power.