3.4 Economics of inequality and poverty
Another macroeconomic goal is to achieve an equitable distribution of income. Despite being similar-sounding words, equity and equality in income distribution are very different concepts, and a distinction should be made between them.
Equality in the distribution of income is concerned with the statistical equality of income distribution.
Equity in the distribution of income is concerned with the fairness in the distribution of income and involves an element of moral judgment as to what kind of distribution is considered just.
To elaborate, consider an economy with 10 people, and a total income of $10,000. When one considers equality, one considers how equally the income is distributed. In an absolutely equal situation, each one would have an income of $1,000. When considering equity, one would consider which kind of income distribution is just; for instance, in a meritocratic society, it would be fair that higher income goes to the person who has the higher ability and works harder.
The meaning of economic inequality
Economic inequality has two dimensions:
1) Unequal distribution of income
Incomes are earned when individuals sell or hire out their factor of production to others. Unequal distribution of income refers to variations in the amounts of income earned by different people. It may, for example, be the case that some individuals receive little to no income at all whereas others earn high incomes.
2) Unequal distribution of wealth
Income is a ‘flow’ concept. It includes, for example, wages, interests from savings, and rent. Wealth is a ‘stock’ concept; it is the value of a person’s total assets e.g. properties, stock etc. Wealth may also be unequally distributed, with a small proportion of the population holding a large proportion of the wealth.
For example, the Credit Suisse Global Wealth Report 2018 found that globally the poorest 50% of adults owned less than 1% of total wealth and the richest 10% owned 85% of total wealth.
Measuring economic inequality
One way of measuring income equality is by considering the income share that different percentages of the population possess.
Table 3.4.1: Cumulative income distribution (in %) in Canada in 2005.
| Country Name | Cumulative population: poorest 20% | Cumulative population: poorest 40% | Cumulative population: poorest 60% | Cumulative population: poorest 80% | Cumulative population: 100% (everyone) |
|---|---|---|---|---|---|
| Canada | 7.2 | 19.9 | 37.1 | 60.1 | 100 |
In Canada in 2005, the poorest 20% received 7.2% of total income. The poorest 40% together received 19.9%. The latter is the cumulative share of the bottom two quintiles; the second quintile alone received 19.9% − 7.2% = 12.7%.
With perfectly equal incomes, each successive fifth of the population receives 20% of total income. The cumulative shares are therefore 20%, 40%, 60%, 80% and 100%, as in Table 3.4.2. These columns are cumulative population shares, not separate quintiles. With all income concentrated at the very top, the cumulative share remains zero until that income is included.
Table 3.4.2: Cumulative income distribution (in %) in a country with perfect income equality and inequality
| Cumulative population: poorest 20% | Cumulative population: poorest 40% | Cumulative population: poorest 60% | Cumulative population: poorest 80% | Cumulative population: 100% (everyone) | |
|---|---|---|---|---|---|
| Perfect income equality | 20 | 40 | 60 | 80 | 100 |
| Perfect income inequality | 0 | 0 | 0 | 0 | 100 |
In Table 3.4.3, Canada has a larger cumulative income share at each of the first four population cut-offs than South Africa. Both reach 100% at the final cut-off. Canada’s Lorenz curve therefore lies closer to the line of equality in this 2005 comparison.
Table 3.4.3: Cumulative income distribution (in %) in Canada and South Africa in 2005
| Country Name | Cumulative population: poorest 20% | Cumulative population: poorest 40% | Cumulative population: poorest 60% | Cumulative population: poorest 80% | Cumulative population: 100% (everyone) |
|---|---|---|---|---|---|
| Canada | 7.2 | 19.9 | 37.1 | 60.1 | 100 |
| South Africa | 3.1 | 8.7 | 18.5 | 37.4 | 100 |
Lorenz curve
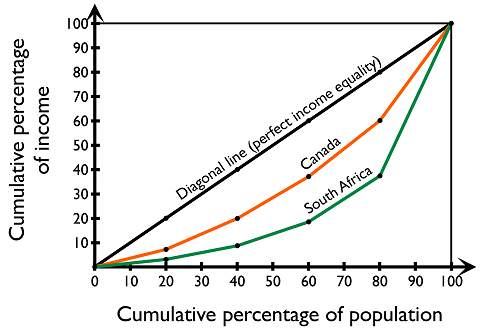
The Lorenz curve shows the degree of inequality of the distribution of income within an economy, showing the cumulative percentage of income attributable to the cumulative percentage of the population when ranked according to their income.
The data in the previous section can also be expressed on a graph, known as the Lorenz curve, with the cumulative percentage of income on the y-axis, and the cumulative percentage of the population on the x-axis. Each point on the Lorenz curve can be interpreted as the income attributable to the bottom x percent of the population when ranked according to income. Information from Table 3.4.3 is plotted onto a Lorenz curve in Figure 3.4.1. The diagonal line implies perfect income equality, meaning that the same cumulative percentage of the population is receiving the same cumulative percentage of income. The “arc” represents increasing inequality, as it is positioned further away from the diagonal line, as is the case when comparing Canada with South Africa.
Gini coefficient
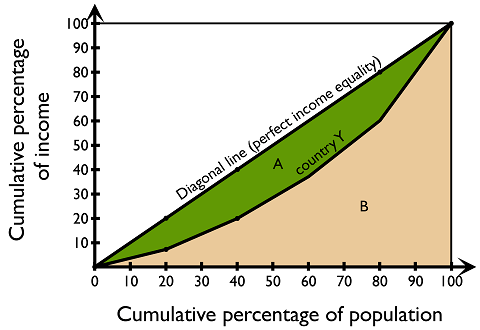
Information in the Lorenz curve can be summarised as the Gini coefficient, which is a measure of inequality in the distribution of income. It takes the value of 0 to 1. 0 represents perfect income distribution, and 1 indicates extremely unequal income distribution. The Gini coefficient calculates the proportion between two areas: the area between the diagonal line and Lorenz curve, and the total area under the diagonal line (Figure 3.4.2), expressed by the following formula:
\( Gini \; coefficient = \dfrac{Area \; between \; diagonal \; line \; and \; Lorenz \; curve \; (A)}{Total \; area \; under \; the \; diagonal \; line \; (A+B)} \)
In the case of perfectly equal distribution of income, the Lorenz curve is equal to the diagonal line, and there is zero area between the diagonal and the Lorenz curve, resulting in a Gini coefficient of 0. At the other extreme, where one person in the economy owns all income, the area between the diagonal line and the Lorenz curve is equal to the total area under the diagonal line, and the Gini coefficient is equal to 1. Thus, a Gini coefficient has a range of values between 0 and 1, and higher value corresponds to greater inequality in income distribution.
The meaning of poverty
When discussing poverty, or the lack of material possessions and wealth, one needs to distinguish between the notions of absolute poverty and relative poverty. Absolute poverty is defined in terms of the minimal requirements needed to afford minimal standards of food, clothing and other living expenses, and the 2008 World Bank international poverty line is set at US$1.25 per day (PPP).
Relative poverty is measured in comparison to a median income level in an economy. For example, the Social Metrics Committee in the UK considers any family that has less than 54% of the income of the median family in the country to be in poverty.
Measuring poverty
Poverty lines
Absolute poverty is measured using the World Bank’s international poverty line. Anybody whose income falls below that line (US$1.25 per day (PPP)) is considered to be in poverty.
Individual countries also set their own ‘national poverty lines’, which reflect relative poverty. National poverty lines tend to be set at an arbitrary percentage of the median income; for example, the UK’s national poverty line is defined as income below 60% of average income, or around £195 a week.
Minimum income standards
Instead of using poverty lines as outlined above, countries could set the poverty line at the minimum amount of income that households need to meet their basic needs for goods and services. For example, the Joseph Rowntree Foundation found that in the UK in 2019 a single person needs to earn £18,800 per year to reach an acceptable living standard. This is significantly higher than the UK’s national poverty line, which is an income of £10,140 a year; if we were to measure the UK’s poverty level with the minimum income standard rather than the poverty line, many more people would be considered to be living in poverty.
The Multidimensional Poverty Index (MPI)
A composite indicator of poverty is the MPI. This aims to measure the many dimensions of poverty, including health, education, and standard of living, rather than focusing on income. The MPI specifies ways to measure each of the dimensions, known as indicators, and what it means to be poor or deprived in each of the indicators.
For example, the MPI considers someone to be ‘deprived’ of drinking water if the household does not have access to improved drinking water or safe drinking water is at least a 30-minute round trip from the home.
A person is classified as multidimensionally poor if the household is deprived in indicators whose combined weights reach at least one third of the total. This is a weighted deprivation score, not a simple count of one third of the indicators.
Difficulties in measuring poverty
There are several problems associated with measuring poverty.
1) There are many types of poverty, making it difficult to define in a consistent way across countries.
2) Some elements of poverty are impossible to be measured, for example the feelings of uncertainty and vulnerability associated with living in poverty.
3) Measures of poverty are often based on household surveys, which require a lot of resources; this means that they may be of poor quality in countries which do not have sufficient resources.
4) Governments are judged on their ability to support people in poverty, and to decrease the levels of poverty in their countries. It is therefore in their interest to adjust poverty measures to reduce the official extent of poverty in the country.
Causes of poverty
Poverty can be caused by the following factors:
(1) Low income
Households with an income barely sufficient to meet necessities for survival, like food, shelter and healthcare, find it difficult to accumulate savings for the formation of human or physical capital, leading to sustained poverty.
(2) Unemployment
Households generate income by renting out the factors of production that they own. Income can be divided into labour income derived from labour effort, and non-labour income that is derived from land and capital. Low-income households in many cases do not own factors of production beyond labour. Unemployment, therefore, can have a negative impact on their income, leading to poverty.
(3) Lack of human capital
Income is determined by the supply and demand for that type of labour. If there is a low supply of high-skilled labour, wages for that labour will be high, and if there is a high supply of unskilled labour, wages for that labour will be low.
However, the wages of skilled workers have tended to rise at a higher rate than those of unskilled workers, leading to higher inequality.
(4) Inequality of opportunity
Different people in society face unequal opportunities. A child with a middle- or upper-class family is likely to be pushed to succeed with their education and go to university, allowing them to get a job with a good income which means that they can save income and have enough collateral to borrow money to buy a house. They are also likely to enjoy better health and therefore more longevity.
In contrast, a child from a poor household may suffer from health issues, for example from poor nutrition; they are likely to drop out of school early and not attend university, making it difficult for them to get a job that guarantees a good standard of living and to save money as they will have to spend the majority of their income on meeting their basic needs.
This illustrates the fact that children who are born in poverty are likely to have few opportunities to move out of poverty; this is known as the poverty trap.
Another problem is the issue of ‘social mobility’, that is, the ability of people to move up or down the socioeconomic ‘ladder’. If a child born into a poor family were able to go to university and get a job where they earn a high income, there would be good social mobility; however, this is not the case in most countries.
(5) Different levels of resource ownership
People who own physical or financial capital can earn profits and dividends. People with higher incomes own larger amounts of physical and financial capital and therefore earn money from savings and dividends, but those with lower income tend to not own capital, and get the majority of their incomes from wages. Average profits and the value of shares have risen faster than average wages, meaning that inequality of incomes has worsened.
(6) Discrimination
Inequality might also result from discrimination against people due to their gender, race, ethnicity, or sexual orientation. Discrimination may stop certain people from gaining opportunities, and it may also alter the outcomes they obtain; for example, wage discrimination occurs when people working in similar positions receive different wages due to factors like gender, race, and ethnicity.
For example, according to the Office for National Statistics, in 2019 the UK had a gender pay gap for full-time employees of 8.6%, meaning that the average pay for women working full-time is 8.6% lower than for men working full-time.
(7) Unequal status and power
When the ownership of resources is concentrated among a small group in a country, those people will have more of a say in the setting of government policy. This is because politicians running for office ask for donations from the public, meaning that they are likely to develop policies that are in the interests of their wealthy donors once elected.
In contrast, those with low incomes are less likely to become involved in politics, so they may not be adequately represented in government policy.
(8) Government tax and benefits policies
Most governments implement ‘progressive’ tax policies which take a higher proportion of tax at higher levels of income. However, the top rate of income tax, corporate taxes, and taxes on income from savings, dividends, and capital gains, has fallen. This benefits people with higher incomes and significant wealth, and widens inequality.
Movements towards austerity to combat government debt have also increased inequality, as austerity involves less spending in areas aimed at redistributing income, such as social welfare benefits like child benefit and unemployment benefits.
(9) Globalisation and technological change
Companies can now locate their production facilities all around the world. At the same time, technological progress means that machines are able to do the work that skilled workers used to do. This means that there is less demand for manufacturing workers in developed countries, leading to increasing structural unemployment.
At the same time, demand for workers with higher education in sectors like the financial and information technology industries has risen, leading to higher incomes in those sectors. This has compounded inequality.
(10) Market-based supply side policies
There is a strong correlation between such policies and inequality. Deregulation in financial markets allows wealthy people to earn more income from their investments, and labour market reforms to reduce the power of trade unions and make labour markets more flexible mean that workers cannot use collective bargaining power to protect their wages and working conditions.
The impact of income and wealth inequality
Economic growth
There is a debate about the link between inequality and economic growth.
It is arguable that gaps between high- and low-income groups are necessary to provide incentives for hard work, entrepreneurship, and innovation. It is also arguable that high levels of investment are needed for economic growth, and that the pools of savings necessary for investment will not be available in an equal society.
However, it can also be argued that inequality harms economic growth as the vicious cycle of poverty can undermine productivity and damage growth. There is also often social and political instability associated with inequality, which can deter growth.
Standards of living
High levels of income inequality means that some people are living in some degree of poverty. This leads to unacceptably low living standards, where people have to make choices between which of their needs they use their limited income to meet.
Social stability
In unequal societies, low-income families might become concentrated in certain neighbourhoods and areas where, for example, housing is cheaper. These areas might not have good schools and might have poor infrastructure and facilities, so opportunities are limited for residents.
Social stability will also be undermined in areas of high inequality, as people who are living in poverty might be resentful and hostile. This leads to social tension and increased criminal behaviour, particularly among young people. People living in impoverished areas may therefore feel unsafe, and face threats to their property.
High inequality is also likely to lead to decreased support for the political system and democratic process, as these are seen as unfair. This can give rise to an unstable sociopolitical climate.
The role of taxation in reducing poverty, income and wealth inequality
Progressive, regressive and proportional tax
Taxes can also be classified according to the relationship between income level and percentage paid as tax.
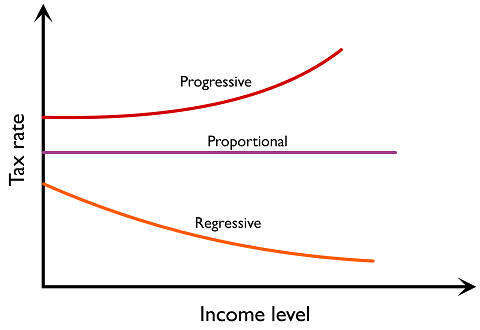
Progressive tax means as income increases, the proportion of income paid as the tax also increases. (Figure 3.4.3) Most income tax systems in the world are progressive in nature.
Proportional tax means as income increases, the proportion of income paid as tax remains constant. Some income tax systems in the world are proportional in nature, for instance, those of the Baltic countries (Estonia, Latvia and Lithuania) in Europe.
Regressive tax means as income increases, the proportion of income paid as tax decreases. Examples include an indirect tax on food, fuel and other essential items. As both high and low-income households pay the same absolute amount of tax on a good, low-income households spend a higher proportion of income as tax than high-income households. Hence indirect tax is regressive.
Calculation of tax rates
Higher level students are required to know how to calculate average tax rates, marginal tax rates and the total amount of tax payment.
Average tax rate is the percentage of income paid as taxes
\( Average \; tax \; rate = \frac{Tax \; amount}{Income \; level} \times 100\% \)
Marginal tax rate is the percentage of tax paid on the extra income earned.
\( Marginal \; tax \; rate = \frac{Additional \; tax}{Additional \; income} \times 100\% \)
Table 2.3.22
| Net chargeable income | Tax rate |
|---|---|
| First $40,000 | 2% |
| Next $40,000 | 7% |
| Next $40,000 | 12% |
| Remainder | 17% |
| Basic tax allowance: $120,000 | |
Consider someone who has income of $210,000 in the year 2012/13 and the basic tax allowance is $120,000.
To find the total tax payment and the average tax rate
(1) Find out the net chargeable income.
Net chargeable income = Total income-basic tax allowance
$210,000-$120,000 = $90,000
(2) Find out total tax payment at each marginal tax rate level.
Given net chargeable income is $90,000,
First $40,000 tax amount = $40,000 × 2% = $800
Next $40,000 tax amount = $40,000 × 7% = $2,800
The next $10,000 tax amount = $10,000 × 12% = $1,200
Therefore the total tax payment is: ($40,000 × 2%) + ($40,000 × 7%) + ($10,000 × 12%) = $4,800
(3) Find out the average tax rate from the total tax payment level obtained in (2)
The average tax rate = \( \frac{$4,800}{$210,000} \) × 100%
= 2.29%
Historical calculation: Hong Kong, 2012/13. The $4,800 liability and 2.29% average rate above are before the one-off tax reduction. The exercise excludes that reduction. In that year, the reduction was 75%, capped at $10,000 per case. On these facts, it reduces tax by $3,600 to $1,200; the average rate after reduction is $1,200 ÷ $210,000 × 100 ≈ 0.57%. IRD: 2012/13 reduction
Direct taxes
Direct taxes are taxes imposed on people’s income or wealth, or company profits. This is paid directly to the government by the persons on whom the taxes are imposed.
There are three kinds of direct tax:
1) Direct taxes on personal income
These are paid in the form of income taxes; every year, households fill out a tax return, recording the income that they have received. They then owe an amount of tax based on this income.
For example, in the UK in 2020 anyone earning more than the ‘Personal Allowance’, or tax-free amount, of £12,500 has to pay a proportion of their income in tax. The ‘Basic Rate’ of 20% applies to those earning between £12,501 and £50,000; the ‘Higher Rate’ of 40% applies to those earning between £50,001 and £150,000, and the ‘Additional Rate’ of 45% applies to those earning more than £150,000.
2) Direct taxes on corporate income
Businesses also pay taxes on their profits; these are known as corporate taxes.
For example, the corporate tax rate in France in 2020 is 28% regardless of the value of the company’s profits.
3) Direct taxes on wealth
These are taxes that are levied based on the value of people’s financial assets. For example, you might be taxed based on the value of your house.
For example, in the 2020 Democratic primary election in the US, Senator Elizabeth Warren proposed instituting a 3% wealth tax. Under this, for example, Bill Gates would have to pay $6.4bn in taxes every year. If this wealth tax had been in operation since 1982, Jeff Bezos, currently the wealthiest man in the world, would only have been about half as rich as he is now.
Indirect taxes
Indirect taxes are taxes imposed on expenditure on goods and services, like value-added tax or sales tax.
In the UK in 2020, the standard VAT rate was 20%. Not every purchase attracted that rate: books, for example, were generally zero-rated, while qualifying education was exempt. Zero-rating and exemption both mean no output VAT is charged to the purchaser, but they differ in the supplier’s entitlement to recover input VAT.
Indirect taxes are regressive. That is, people with lower incomes spend a relatively higher proportion of their income on indirect taxes than people with higher incomes. They therefore contribute to inequality.
However, indirect taxes are also an important source of revenue for the government; the government can use this revenue to increase spending on policies to reduce inequality, such as increasing unemployment benefits.
The sales tax rate in California is 7.25%. A customer wants to buy a fridge costing $450.
- How much sales tax will the consumer pay on the purchase?
- What will be the consumer’s total expenditure on the fridge?
\(450\times 0.0725=32.625\)
\(450\times 1.0725=482.625=$482.63\)
Further policies to reduce poverty, income and wealth inequality
Policies to reduce inequalities of opportunities/investment in human capital
Governments need to design policies that promote equal opportunities for people regardless of their income levels; this requires targeted government spending on lower-income households.
Examples of such policies include public health insurance so that all households have access to healthcare; conditional cash transfers, or payments to families on the basis that they met requirements related to their children’s education and health; recruitment of quality teachers in lower-income areas, and free school meals to ensure that low-income children have sufficient and nutritious food.
Transfer payments
Transfer payments refer to payments made by the government to individuals, for which no good or service is exchanged. By giving out transfer payments, the government can directly redistribute income collected in taxes, thus reducing the income gap between low and high income households. Examples of transfer payments include old age pensions, unemployment benefits, and child allowances.
Targeted spending on goods and services
Apart from taxation, the government can also promote equity through its choice of public expenditure. The government can directly provide or subsidise the provision of socially desirable goods such as health care, education and clean water, thereby making them available to low income households.
Universal Basic Income (UBI)
A universal basic income is a guaranteed amount that each citizen receives, regardless of their position in society, eligibility, and other requirements. Each citizen would receive the same amount.
Some people argue that a UBI might disincentive people from working; however, a UBI would only be enough to meet basic needs and keep people out of poverty. It is also argued that a UBI would be too expensive, but in response to this it is arguable that the benefits of reducing poverty in society would accrue to everybody, so an increase in marginal tax rates on the rich would be justifiable to fund a UBI.
Policies to reduce discrimination
All people in society should have the same access to services, jobs, and opportunities regardless of their gender, disabilities, race, and other characteristics. The government can put in place policies which reduce discrimination and thus reduce inequalities associated wth discrimination.
Examples of such policies include laws ensuring equal pay for equal work; diversity quotas to make sure that members of different groups are equally represented in companies, and legislation to make discrimination in education admissions and employment hiring illegal.
Minimum wages
The minimum wage rate is the “minimum amount of remuneration that an employer can legally pay a worker”. Instituting a minimum wage ensures that the problem of ‘working poverty’, where workers are working but earning insufficient income to meet their needs, is less likely to occur.
There are, however, potential counterarguments against instituting a minimum wage. For example, it is argued that a minimum wage will actually be harmful to low-income workers as it will incentivise firms to decrease the quantity of labour demanded, or that employers will choose to replace workers with machines. However, there is no empirical evidence for a relationship between a minimum wage and unemployment, and much of the work that is done by minimum wage workers cannot be done by machines.
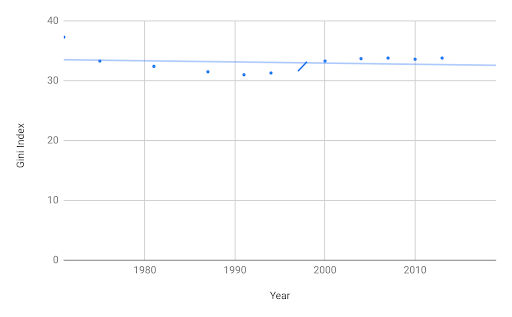
The graph below shows Canada’s Gini Index over time, alongside a trend line to indicate the average level of inequality in Canada. Canada’s Gini coefficient tends to be in the low 30s; this indicates that it has a relatively low level of inequality.
Policies to reduce inequality of opportunity
Canada has both a public and a private education system, with the former being heavily subsidised by the government. In 2016/17, Canada spent $68,138 million on public schools, making up around 12% of the government’s total expenditure. According to the National Center for Education Statistics, in 2016 Canada spent $11,100 per full-time equivalent student for elementary and secondary education, well above the OECD average of $9,800.
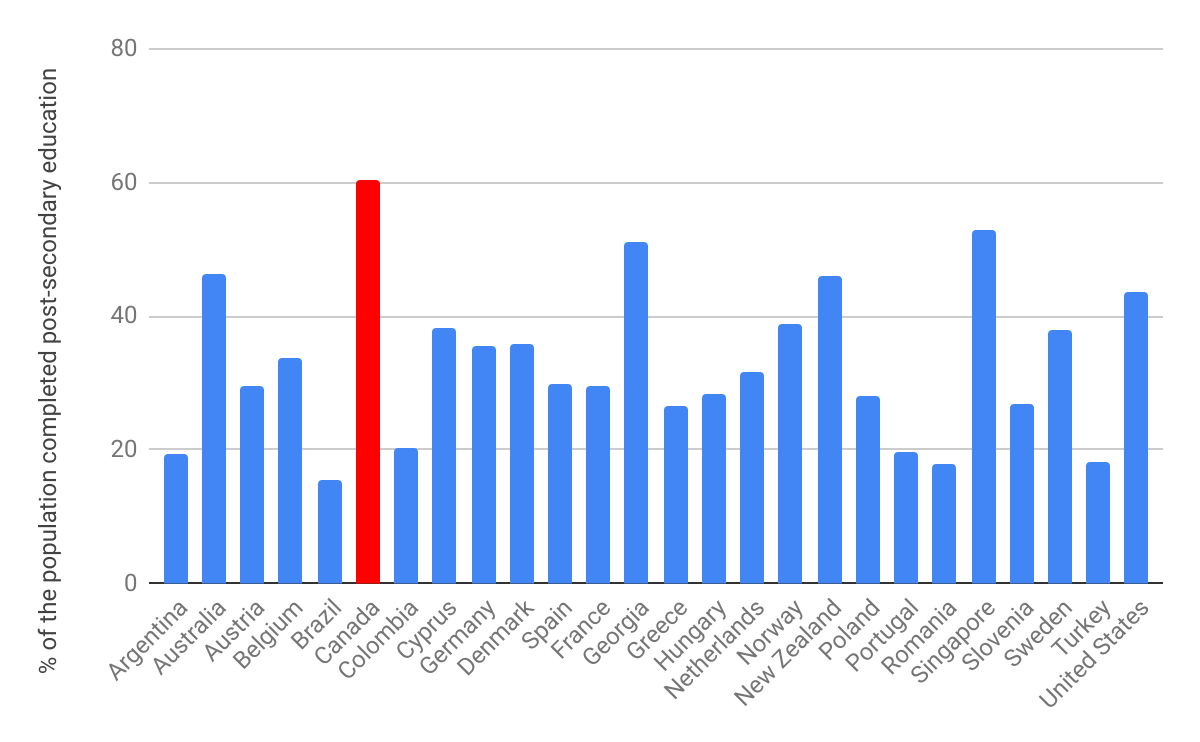
The graph below shows the proportion of the population that has completed post-secondary education in a selection of countries in 2016. It shows that this value is relatively high for Canada, indicating that its high levels of spending on education are successful in improving the quality of human capital in the country.
Transfer payments and targeted spending on goods and services
In 2018, the Canadian government spent 17.3% of GDP on social spending, which includes cash benefits, direct provision of goods and services, and tax breaks with social purposes.
The Canada child benefit (CCB) is a monthly payment to eligible families with children under 18. For July 2020–June 2021, the maximum annual benefit was C$6,765 per child under 6 and C$5,708 per child aged 6–17. For two eligible children aged 4 and 9 and adjusted family net income of C$55,000, the annual benefit was C$6,765 + C$5,708 − 0.135 × (C$55,000 − C$31,711) = C$9,328.985, or approximately C$9,329. This assumes full-year eligibility and excludes separate supplements. Adjusted family net income is the programme’s income measure, not simply gross salary.
The Canadian government also directly provides healthcare; all provinces in Canada provide universal, publicly funded healthcare to citizens, permanent residents, and certain temporary residents. On average, around 70% of expenditure on healthcare in Canada is subsidised by the government, with the remainder being paid for privately.
Universal Basic Income (UBI)
Ontario launched a Basic Income Pilot in 2017. It was a means-tested guaranteed-income experiment, rather than a universal payment to everyone. Under this programme, single participants received up to $16,989 a year and couples received up to $24,027. The beneficiaries of the programme reported using the additional funds to augment disability payments, pay for education, fund transportation, and purchase necessities such as food and warm clothes which they were previously unable to afford.
The quoted amounts were maximum annual payments in Canadian dollars. Payments were reduced by 50 cents for each dollar of earned income. This withdrawal rule and the restricted eligibility distinguish the pilot from a universal basic income.
Policies to reduce discrimination
The Canadian Human Rights Act (1977) protects Canadians from discrimination on the grounds of race, ethnicity, colour, religion, age, sex, sexual orientation, gender identity, marital status, family status, disability, genetic characteristics, and convictions for which a pardon has been granted.
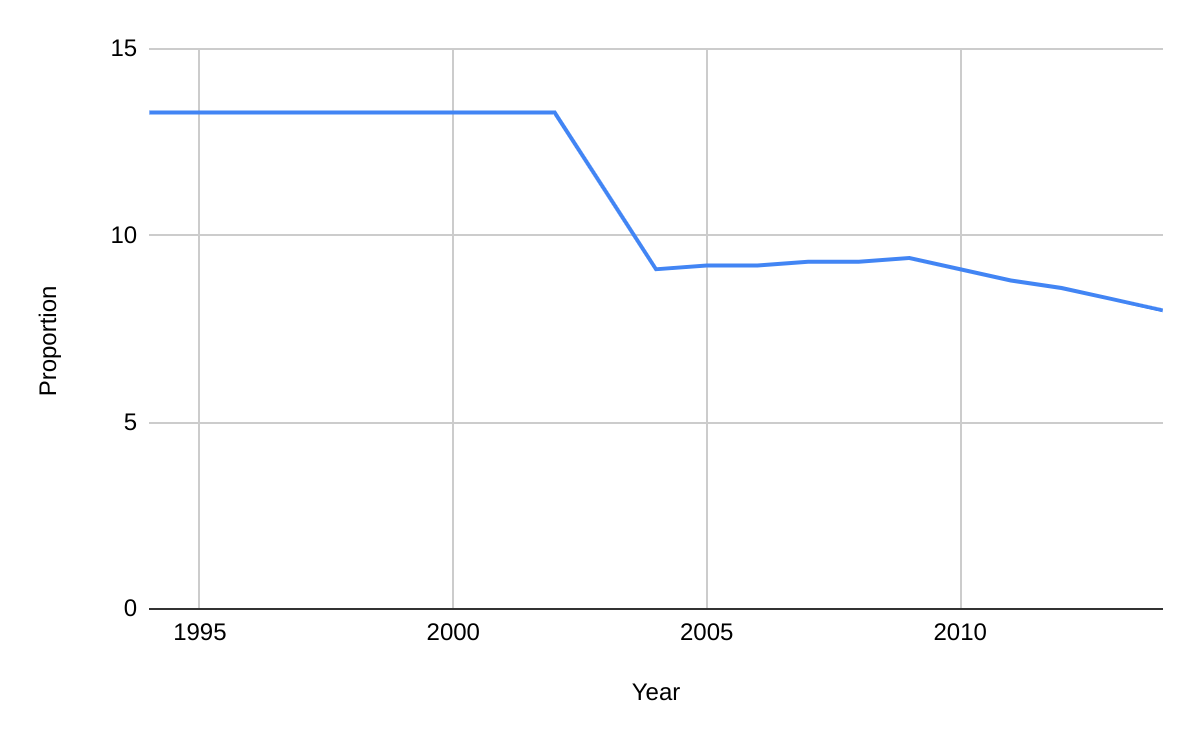
The Canadian Index of Well-being reports on quality of life in Canada. One of the indicators that it reports is attitudes towards others and community; this represents the percentage of the population who have experienced discrimination or been treated unfarly by others because of their ethnicity or culture in the last five years.
The graph below reports that indicator between 1994 and 2014; it shows that the proportion of the population who have experienced discrimination has been dropping over time.
https://uwaterloo.ca/canadian-index-wellbeing/what-we-do/domains-and-indicators/percentage-experiencing-discrimination-past-5-years-based
Minimum wages
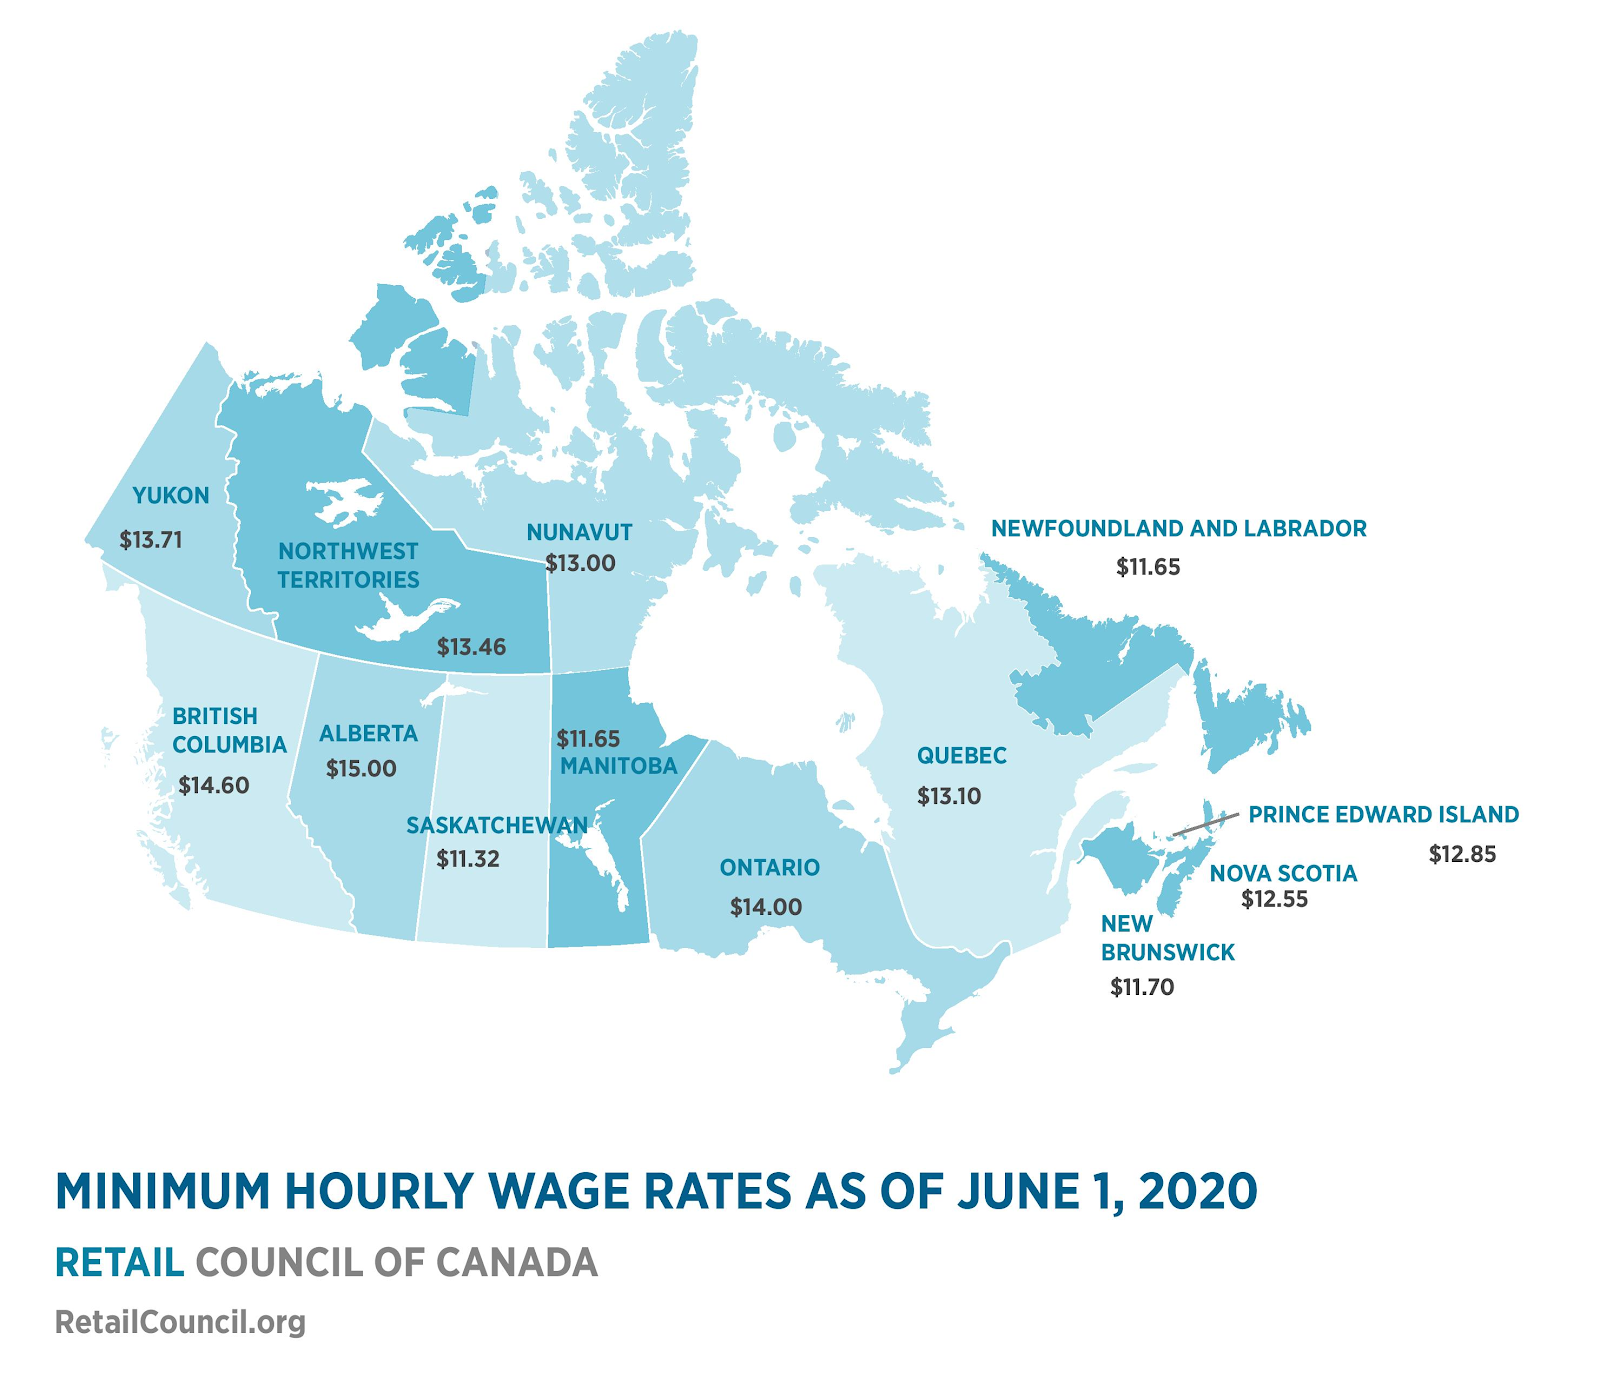
The graphic below shows the minimum wage rate in each of Canada’s provinces in 2020.
https://www.retailcouncil.org/resources/quick-facts/minimum-wage-by-province/
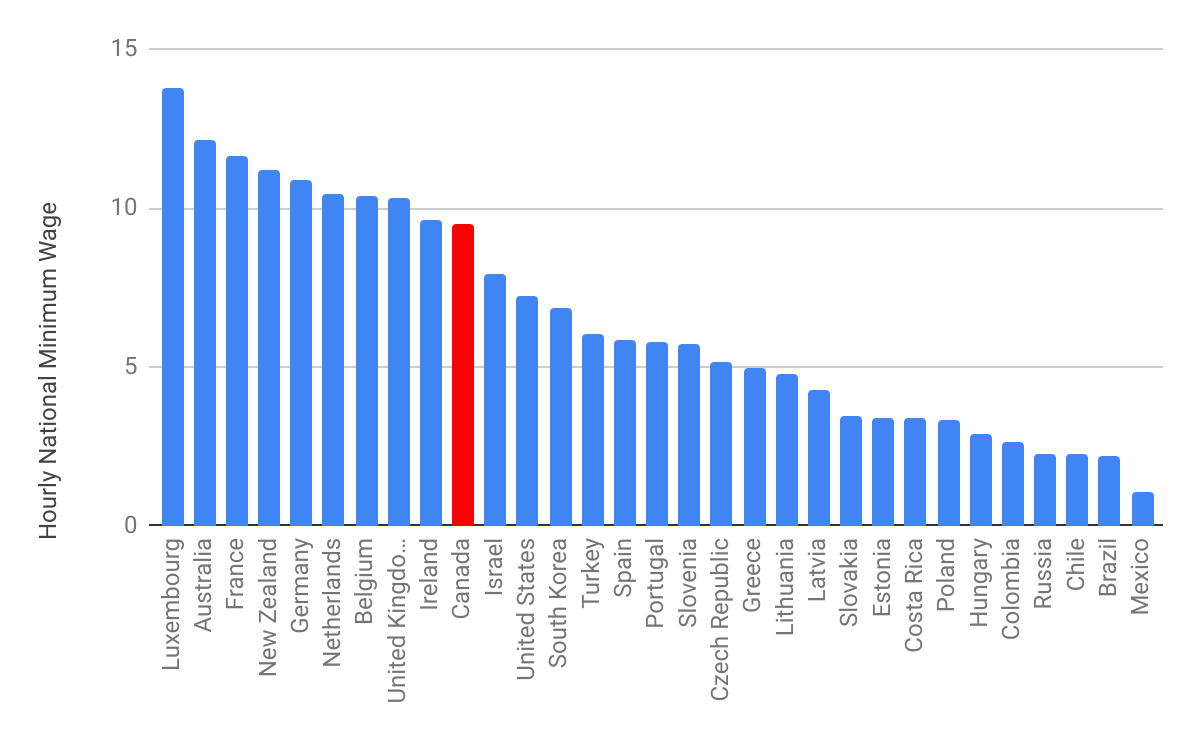
Canada’s National Minimum Wage is relatively high in comparison to other countries which have instituted a National Minimum Wage. The graph below compares Canada’s NMW to that of other countries: