Oligopoly involves a few interdependent firms whose decisions depend on rivals' responses.
Must know
- Concentration ratios measure the largest firms' combined share.
- Collusion differs from competition.
- Price and non-price strategies affect stakeholders.
Must know definitions
Oligopoly: a market dominated by a few large, interdependent firms with high barriers to entry and exit.
Concentration ratio: the combined market share of the largest n firms in an industry.
Interdependence: the situation where one firm's decisions directly affect, and are affected by, the decisions of its rivals.
Collusion: cooperation between firms (overt or tacit) to reduce competition, e.g. by fixing prices or restricting output.
Cartel: a group of firms that formally agree to control prices, output, or market entry.
Price leadership: when a dominant firm sets the price and other firms follow.
Price war: repeated, escalating price cuts between rival firms.
Limit pricing: setting price low enough to deter entry, without necessarily being illegal.
Predatory pricing: a strategy of pricing below a relevant cost benchmark to exclude rivals and weaken competition. Whether it is unlawful depends on the jurisdiction and legal test; low prices or losses alone do not establish an infringement.
Must know relationship: n-firm concentration ratio = combined sales of largest n firms / total market sales × 100.
Calculation: use sales for the largest n firms and the whole market from the same period and market definition. Report a percentage between 0% and 100%; concentration alone does not prove collusion.
Explain and apply
Mechanism in brief: A firm's price or output decision changes rivals' profits and may trigger retaliation. Anticipated responses can discourage price cuts or encourage coordination, but each cartel member may gain by secretly undercutting.
Distinguish: High concentration does not prove collusion; a payoff matrix must be read from each player's perspective.
Use the extract: Use market shares, barriers and rival behaviour; in a payoff matrix compare each firm's options conditional on its rival's choice.
Assumptions of oligopoly
An oligopoly is a market with a high concentration ratio — a small number of firms supply the majority of the market — where firms are interdependent (the pricing and output decisions of one firm directly affect and are affected by rivals), there are high barriers to entry and exit, and firms may produce either similar or differentiated products.
- Supermarkets and airlines are typical real-world examples.
high concentration ratio + interdependence + high barriers to entry/exit → firms cannot ignore rivals' reactions → strategic (game-theoretic) behaviour
Concentration ratio
The n-firm concentration ratio measures the combined market share of the largest n firms in an industry, and is used to judge how concentrated (and therefore how oligopolistic) a market is.
- A higher n-firm concentration ratio means that the largest n firms account for a greater share of the defined market. It may indicate market power, but rivalry, imports, contestability and how the market is defined also matter.
concentration ratio ↑ → market share concentrated in fewer firms → may increase market power and weaken competitive pressure, depending on entry barriers and rivalry
For example, historical British grocery-market shares for the 12 weeks ending 29 March 2015 were: Tesco 28.4%, Asda 17.1%, Sainsbury’s 16.4%, Morrisons 10.9%, The Co-operative 6.0%, Aldi 5.3%, Waitrose 5.1%, Lidl 3.7% and Iceland 2.1%. These are historical figures, not current market shares. Kantar Worldpanel’s release of 8 April 2015 confirms the four largest retailers’ combined share of 72.8%.
| Concentration ratio | Calculation | Result |
|---|---|---|
| 2-firm (CR2) | 28.4% + 17.1% | 45.5% |
| 4-firm (CR4) | 28.4% + 17.1% + 16.4% + 10.9% | 72.8% |
Calculate an n-firm concentration ratio by summing the shares of the largest n firms. If only sales values are given, calculate combined sales of the largest n firms ÷ total market sales × 100 first.
Barriers to entry and exit
Barriers to entry are obstacles that limit a firm's ability to enter or expand into a market; barriers to exit are factors that make it costly or difficult for a firm to leave.
- High barriers on both sides help preserve the market power of incumbent firms, since new competitors are deterred and loss-making firms cannot easily leave to relieve excess supply.
| Barriers to entry | Barriers to exit |
|---|---|
| Economies of scale — incumbents produce more cheaply than a new small entrant could | Sunk costs — irretrievable spending (e.g. advertising, specialised equipment) lost if the firm exits |
| Legal barriers — patents, licences, exclusive rights | Redundancy costs — cost of making workers redundant |
| Branding and consumer loyalty — makes demand more price inelastic and switching less likely | Contractual costs — leases and contracts that must still be paid after closure |
| Limit pricing and predatory pricing — deter or remove rivals | Loss of brand value/goodwill built up over time |
| Vertical integration and brand proliferation — control over supply chain or shelf space | — |
Diagram analysis
Because products may be similar or differentiated, an oligopolist typically faces a downward-sloping AR curve, similar to a monopolistically competitive firm.
- The firm profit maximises where MC = MR, producing at output Q and charging price P.
- Where AR lies above ATC at this output, the firm earns supernormal profit — shown as the shaded area between AR and ATC.
- Unlike monopolistic competition, high barriers to entry mean this supernormal profit is not eroded by new entrants, so it can persist into the long run.
Figure 3.17 Firm output price and profit
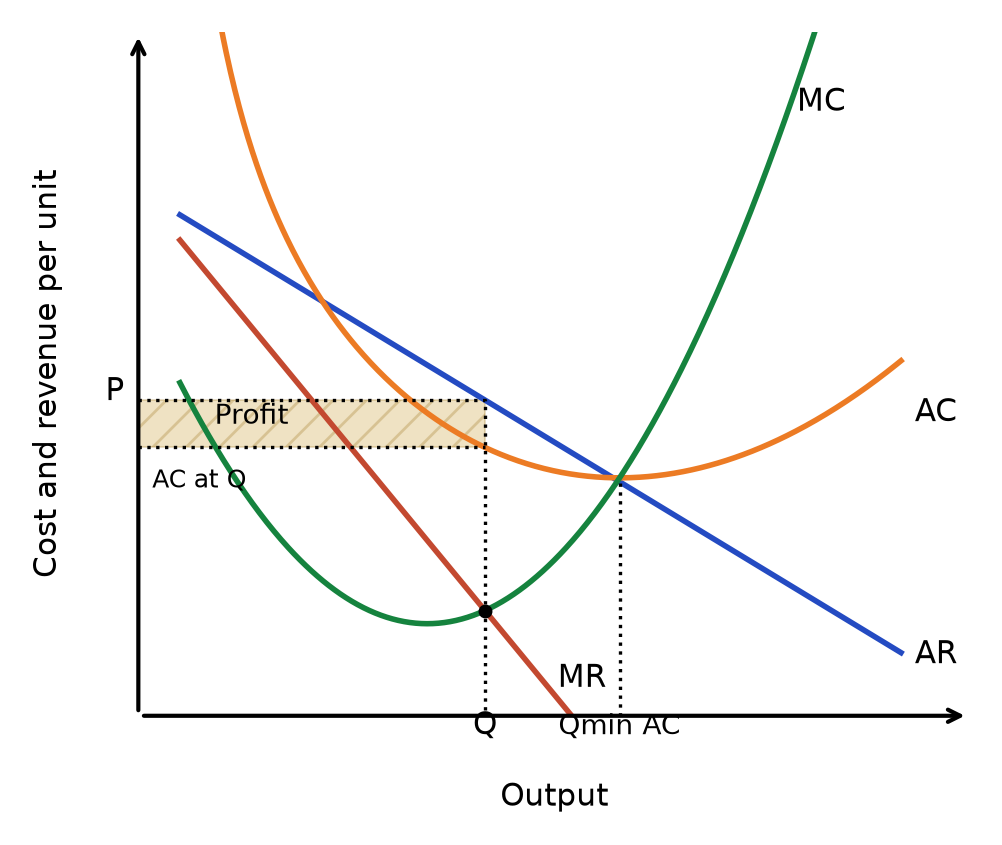
Read the diagram: Find Q where rising MC crosses MR → read P vertically above Q on AR → read AC at the same Q → profit is (P − AC) × Q, shown by the rectangle. Higher AC could turn this profit into a loss; downward-sloping demand alone does not guarantee profit.
downward-sloping AR (similar/differentiated products) → firm profit maximises at MC = MR → output Q, price P → AR above ATC at Q → supernormal profit
high barriers to entry → supernormal profit not competed away → profit can persist into the long run
Efficiency assessment
| Efficiency type | Achieved? | Reasoning |
|---|---|---|
| Allocative efficiency | No | High barriers to entry and interdependent pricing keep P > MC; collusion (where it occurs) worsens this further by deliberately restricting output |
| Productive efficiency | Not guaranteed | The chosen output may differ from minimum AC. Check the illustrated cost and demand conditions; market power alone does not prove that minimum AC can never be reached. |
| Dynamic efficiency | Limited/Yes | Retained supernormal profit (protected by high barriers to entry) can fund R&D and investment; however, collusion can weaken the incentive to innovate since firms face less competitive pressure to differentiate |
| Economies of scale | Possible | Large-scale production is common given high barriers to entry, allowing firms to lower average costs — though this same scale is itself a barrier that reduces contestability |
Impact on stakeholders
| Stakeholder | Pros | Cons |
|---|---|---|
| Consumers | Non-price competition (quality, service, loyalty schemes) and price wars can lower prices and improve product/service quality | Collusion, price leadership, and high barriers to entry can keep prices high and output low, reducing consumer surplus |
| Producers | Retained supernormal profit funds investment and R&D; economies of scale lower costs; collusion (where sustained) raises joint profits | Price wars can erode profits for all firms; distrust between rivals can prevent collusion from being sustained (prisoner's dilemma) |
| Government | — | Must monitor and regulate against anti-competitive practices such as cartels, predatory pricing, and abuse of market power |
| Labour | Stable, profitable firms may offer more secure employment and wages | Weaker competitive pressure (especially under collusion) may reduce the urgency to invest in productivity, indirectly limiting wage growth |
| Society | Economies of scale and retained profit can support innovation and lower long-run costs | Restricted output and higher prices under collusion cause a loss of allocative efficiency and overall welfare |
Interdependence of firms and game theory
Because oligopolists are interdependent, each firm must anticipate how rivals will react to its decisions — this strategic interaction is modelled using game theory, most commonly the prisoner's dilemma, using a payoff matrix showing the profit outcome for each firm under every combination of prices the two firms could set.
| Firm X: £2 | Firm X: £1.80 | |
|---|---|---|
| Firm Y: £2 | Firm Y: £10m, Firm X: £10m | Firm Y: £5m, Firm X: £12m |
| Firm Y: £1.80 | Firm Y: £12m, Firm X: £5m | Firm Y: £8m, Firm X: £8m |
A dominant strategy is a strategy that gives a firm a better outcome regardless of what its rival does.
- Here, look at Firm X's decision from each of Firm Y's perspectives: if Firm Y sets £2, Firm X earns £10m by matching at £2 but £12m by undercutting at £1.80 — undercutting is better.
- If Firm Y sets £1.80, Firm X earns £5m by staying at £2 but £8m by matching at £1.80 — undercutting is again better.
- Since £1.80 is Firm X's best response whichever price Firm Y chooses, £1.80 is Firm X's dominant strategy. By the same logic (the game is symmetric), £1.80 is also Firm Y's dominant strategy.
firm X compares outcomes under both of firm Y's choices → £1.80 always gives firm X a higher profit than £2 → £1.80 is firm X's dominant strategy, regardless of what firm Y does
A Nash equilibrium is reached when each firm is playing its best response to the other firm's strategy, so that neither firm can improve its own outcome by unilaterally changing its own price.
- Since £1.80 is a dominant strategy for both firms, both firms set £1.80, giving each £8m — this (£1.80, £1.80) outcome is the Nash equilibrium, since neither firm gains by deviating to £2 while the other stays at £1.80.
both firms play their dominant strategy (£1.80) → neither firm can do better by unilaterally switching to £2 → (£1.80, £1.80) is the Nash equilibrium
The prisoner's dilemma is that this Nash equilibrium (£8m each, £16m joint profit) is worse for both firms than the cooperative outcome of both setting £2 (£10m each, £20m joint profit) — mutual self-interest, pursued independently, leads to a worse outcome for both firms than cooperation would.
- This is exactly why oligopolists have a strong incentive to collude: by agreeing (formally or tacitly) to set the higher price of £2 rather than compete independently, both firms can escape the Nash equilibrium and capture the higher joint profit that price competition would otherwise compete away.
- However, this incentive to collude coexists with a simultaneous incentive to cheat on any such agreement, since each firm could still individually gain by secretly undercutting the other from £2 to £1.80 — this tension is exactly why collusive agreements are often difficult to sustain.
both firms acting in self-interest → reach Nash equilibrium (£1.80, £1.80) → lower joint profit than if both had cooperated at £2 → incentive to collude on the higher price to capture the larger joint profit
collusive agreement reached at £2 → but each firm could still gain individually by secretly undercutting to £1.80 → incentive to cheat undermines the stability of collusion
Collusive and non-collusive behaviour
Collusive behaviour occurs when firms cooperate — for example agreeing on price or output — instead of competing, which reduces the competitive pressure they face and raises joint profits.
- Collusion is more likely where there are only a few firms with similar costs, high entry barriers exist, detection is unlikely, competition policy is weak, and consumers show inertia (are unlikely to switch).
- Non-collusive behaviour may be more likely when there are more firms, a strong incentive to undercut rivals or substantial differences in costs. Homogeneous products can intensify price competition, but also make prices easier to compare and deviations from an agreement easier to detect. Their effect on collusion depends on monitoring, entry barriers and the gains from cheating.
Collusion can be overt (a formal, explicit agreement — illegal in most countries) or tacit (an implicit understanding with no formal agreement, harder to detect and typically legal).
- A cartel is a group of firms that formally agree to fix prices, restrict output, or block new entrants — OPEC (historically controlling a majority of global oil supply) is a classic example.
- Price leadership occurs when a dominant (often lowest-cost) firm sets the price and other firms follow, since deviating risks losing market share — this helps explain why oligopoly prices tend to be relatively stable.
| Costs of collusion | Benefits of collusion |
|---|---|
| Consumer surplus falls — higher prices, lower output | Can improve industry standards (e.g. shared safety/technology standards) |
| Efficiency falls due to weaker competition, raising average costs | Saves on duplicated R&D spending |
| Reinforces incumbents' market power, raising barriers for new entrants | Excess/pooled profit could fund investment that improves long-run efficiency |
| Lower output reduces allocative efficiency | Larger scale from cooperation can allow economies of scale, lowering prices |
Price competition
Oligopolists may compete on price through:
- Price wars — firms repeatedly undercut each other's prices, which can erode profits for all firms with no lasting gain.
- Predatory pricing — a firm accepts short-run losses to exclude rivals, intending to recover them through greater market power. In the UK, exclusionary below-cost pricing by a dominant firm may constitute abuse of dominance. “Below average cost” is not a universal legal test; distinguish the economic strategy from the legal assessment.
- Limit pricing — not necessarily illegal; setting price just low enough that a potential entrant could not profitably match it, deterring entry without a price war.
Non-price competition
To avoid the mutually damaging effects of price wars, oligopolists often compete through non-price competition instead — for example advertising and branding, product quality, customer service, loyalty schemes, and after-sales service.
Endorsement uses a recognised person or organisation to recommend a product and influence perceived quality or desirability. Product placement puts a branded product into entertainment or other content. Both may strengthen brand loyalty but incur costs; their effectiveness depends on the audience and credibility.
- These methods aim to build brand loyalty, which makes demand more price inelastic and protects market share without triggering retaliation on price.
Costs and benefits of collusion and of price/non-price competition to stakeholders
The effects of collusive behaviour, and of price versus non-price competition, should be assessed across profits, wages, prices paid by consumers, the level of investment, and the quality of goods and services — since the impact can differ sharply by stakeholder and by which strategy firms adopt.
Collusion is harder to sustain when monitoring is weak, firms differ or entry is credible. Evaluate both the incentive to cooperate and the incentive to deviate before predicting stable high prices.
Rapid recap
Interdependence: each firm considers rivals’ responses when setting price, output or advertising. High concentration does not establish collusion.
Game theory: compare each player’s payoffs given each rival choice. A Nash equilibrium requires no profitable unilateral deviation; it need not maximise joint profit.
Judge: cheating incentives, monitoring, entry and differences between firms affect whether collusion lasts. Non-price rivalry can remain strong even when prices are stable.
Diagram cue: use a payoff matrix for interdependence or a firm diagram for price and profit.
Related chapters: Unit 3 chapter 12 (p. 58) · Unit 3 chapter 14 (p. 68)