4.6 Balance of Payments
The structure of the BOP account
The balance of payments (BOP) account is the record of all monetary transactions of a country with the rest of the world over a period of time, usually a year.
Inflow of capital or sources of funds such as exports of goods and services are recorded as positive items or credit items. The outflow of capital or uses of funds such as imports of goods and services are recorded as negative items or debit items.
Components of the balance of payments accounts
| The Current Account (A) = (1) + (2) + (3) + (4) |
(1) The balance of trade in goods (Visible trade)This includes the value of exports minus the value of imports of goods (2) The balance of trade in services (Invisible trade)This includes the value of exports minus the value of imports of services e.g. holiday expenses (3) Factor incomeThis includes the difference between the income received from factors of production abroad and income payable abroad (4) Current transfersThis includes unilateral current transfers without exchange for goods and services |
| The Capital Account (B) = (5) + (6) |
(5) Capital transfersThe transfer of ownership on fixed assets such as equipment, inheritance taxes or debt forgiveness (6) Transactions of non-produced and non-financial assetsThis includes the provision of resources such as land that is needed for production but has not been produced |
| The Financial Account (C) = (7) + (8) + (9) + (10), using the signed balances of the simplified categories below |
(7) Foreign direct investment (FDI)Cross-border investment by a resident investor that establishes a lasting interest and significant influence in an enterprise in another economy. The statistical threshold is ownership of 10% or more of voting power. The investor need not be a multinational corporation. (8) Portfolio investmentCross-border investment in equity and debt securities other than direct investment or reserve assets. Equity holdings below 10% of voting power normally fall here; the 10% threshold distinguishes equity influence and is not a general rule for bond holdings. (9) Reserve assetsGovernment-owned assets such as foreign reserves that are held to finance the balance of payments (10) Official borrowingWhenever a government borrows money from other countries, financial assets enter the country. These are counted on the financial account. |
Current account measures the flow of funds from trade in goods and services of a country with the rest of the world. The sum of net exports of goods and services, net income and net current transfers in a given year is the current account balance.
Current account deficit usually refers to the sum of net exports of goods and services, net income and net current transfers in a given year is negative.
Current account surplus usually refers to the sum of net exports of goods and services, net income and net current transfers in a given year is positive.
Individual elements of BOP can be in deficit or surplus. The overall BOP accounts will always balance, as it is impossible for a country to have more currency flowing out than flowing in unless the imbalance is financed by drawing additional foreign exchange.
The sum of the current, capital and financial accounts is equal to zero. For example, if a country is importing more than exporting, its trade balance will be in deficit, the shortfall will have to be balanced in other ways, such as by income earned from its foreign investments or by depleting central bank reserves. Therefore, when the current account is in deficit, the sum of the capital and financial accounts must be in surplus and vice versa. Similarly, any debits must be matched by credits.
In practice, however, the balance of payments rarely actually balances; there are too many transactions for them to all be recorded accurately. We can therefore write the relationship between the accounts as follows:
Current Account + Capital Account + Financial Account = 0
Calculations of BOP elements
Suppose the Balance of Payments Account of country Y (in millions of US dollars) is given as the table below.
| Total value of exports of goods | 12000 |
| Total value of exports of services | 8000 |
| Total value of imports of goods | 9000 |
| Total value of imports of services | 10000 |
| Factor Income | -3000 |
| Current transfer | 1000 |
| Capital transfer | 50 |
| Transactions of non-produced and non-financial assets | 30 |
| Foreign direct investment | -300 |
| Portfolio investment | - 60 |
| Reserve assets | Y |
i) What is the trade balance?
Trade Balance = X – M = [12000 + 8000 – (9000+10000)]= US $1000 million
ii) What is the current account balance?
| Current Account Balance = | Trade balance + Factor income + Current transfer |
| = | 1000 + (-3000) + 1000 = - US $1000 million |
The current account is in deficit of US $1000 million.
iii) What is the capital account balance?
| Capital Account Balance = | Capital transfer + Transactions of non-produced and non-financial assets |
| = | 50 + 30 = US $80 million |
The capital account is in surplus of US $80 million.
iv) What is the financial account balance?
Current Account + Capital Account + Financial Account = 0
-1000 + 80 + Financial Account = 0
| Financial Account Balance = | 1000 – 80 |
| = | US $920 million |
The financial account is in surplus of US $920 million.
v) What is the change in reserve assets?
The Financial Account = Foreign direct investment + portfolio investment + reserve assets
920 = - 300 – 60 + Y
Y = 920 + 300 + 60
= US $1280 million
The reserve transaction is a credit of US$1,280 million under the net-inflow convention used here. It finances the remaining deficit by selling reserves, so reserve holdings fall by US$1,280 million: the change in the stock is −US$1,280 million, not +US$1,280 million. This calculation assumes zero errors and omissions, no other omitted financial flows, and no valuation changes.
Relationship between the current account and the exchange rate
Current account deficit and the exchange rate
A current account deficit means that the combined balance of trade in goods and services, primary income and current transfers is negative. A widening trade deficit can put downward pressure on the exchange rate, other things equal. However, the current account is not the trade balance alone, and offsetting financial flows can prevent depreciation.
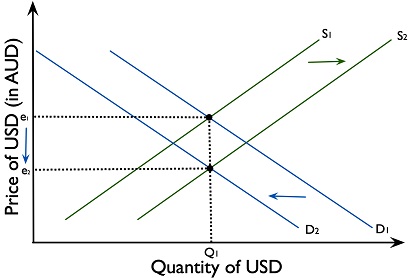
This can be seen in Figure 4.6.1. The combination of an increased supply of the currency and decreased demand for the currency leads to depreciation from e1 to e2. The quantity of currency is uncertain, and it depends on the respective change in the demand and supply of the currency.
Current account surplus and the exchange rate
A current account surplus means that the combined balance of trade in goods and services, primary income and current transfers is positive. A rising trade surplus can put upward pressure on the exchange rate, other things equal, but financial outflows and other transactions may offset this pressure. Appreciation is not inevitable.
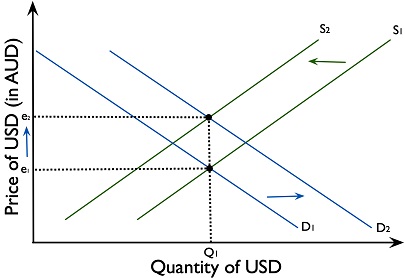
This can be seen in Figure 4.6.2. The combination of a decreased supply of the currency and increased demand for the currency leads to appreciation from e1 to e2. The quantity of currency is uncertain, and it depends on the respective change in the demand and supply of the currency.
Relationship between the financial account and the exchange rate
When there is a surplus on the financial account, more funds are flowing into the country than are flowing out. This increases the demand for the domestic currency, and leads to an appreciation of the exchange rate.
When there is a deficit on the financial account, there is a net outflow of investment funds from the economy. This means that the demand for the domestic currency is going down, and supply of the domestic currency is going up, as investors are selling the domestic currency in order to buy foreign currencies. This leads to the domestic exchange rate depreciating.
Implications of a persistent current account deficit (HL)
1) Indebtedness
A current account deficit is financed by net financial inflows, asset sales or a reduction in reserve assets, allowing also for the capital account. Financing may involve private borrowing, portfolio investment or FDI; it does not necessarily require government borrowing or reserve depletion. Sustainability depends on the size, duration and terms of financing and on whether the funds support future income and repayment capacity.
2) International credit ratings
As the economy needs to borrow to finance the debts, the country has to bear heavy interest rates and loan repayments. The risk of a country going bankrupt increases, and causes a downgrading in the international credit ratings.
3) Foreign ownership of domestic assets
Allowing for the capital account and errors and omissions, a current account deficit has an offsetting financial-account balance. Under the net-inflow convention used in this chapter, this is a financial-account surplus. FDI is one possible source of financing: it can support productive capacity, although profits may later be remitted abroad. Financing need not take the form of foreign ownership of domestic firms.
4) Exchange rate and interest rate
A persistent current account deficit will generate a depreciation or devaluation pressure on the exchange rate. If the government wants to release the pressure, it can raise the interest rate to encourage capital inflow. However, a higher interest rate has a contractionary effect on the economy.
5) A need for demand management
One reason for a persistent current account deficit is the high economic growth that triggers an increase in demand for imports. The government may have to adjust the current account deficit by a contractionary demand management policy. However, this may hinder economic growth.
6) Economic growth
A current account deficit is not necessarily a trade deficit or evidence of weak growth. Falling net exports can reduce aggregate demand, other things equal, but rapid domestic growth may itself raise imports and widen the current account deficit. Imports of productive capital can also support future growth. The cause and financing of the deficit must therefore be examined before judging its effects.
Methods to correct a persistent current account deficit (CAD)
1) Expenditure switching policies
Expenditure switching policies aim at switching expenditure away from imported goods and services to domestically produced goods and services. Trade protection such as tariffs and quotas are implemented to reduce the demand for imports. However, we have studied that trade protection incurs a cost to society as well as a misallocation of resources. Devaluation of the exchange rate may cause imported inflation. These policies have to be carefully monitored.
Between 2018 and 2020, US President Donald Trump imposed a series of tariffs as part of his ‘America First’ economic policy, which aimed to reduce the US’s trade deficit by shifting trade from multilateral free trade agreements to bilateral trade deals.
These tariffs involved:
- In January 2018, tariffs between 30% and 50% were imposed on solar panels and washing machines.
- In March 2018, tariffs were imposed on steel (25%) and aluminium (10%), covering around 4.1% of US imports. These were later lifted from Canada and Mexico in May 2019.
- Following announcements in March 2018, the US imposed 25% tariffs on Chinese imports worth US$34 billion on 6 July 2018, followed by a further US$16 billion on 23 August. The US$50 billion total describes the value of covered imports, not tariff revenue. These measures formed part of the escalating trade dispute.
- On 30 May 2019, a 5% tariff on imports from Mexico was announced for implementation on 10 June. It was suspended on 7 June before taking effect; it was a threatened tariff, not a tariff imposed in May.
Amiti, Redding and Weinstein’s 2019 study estimated that, by the end of 2018, the tariffs generated approximately US$3.2 billion in additional tariff payments per month and a US$1.4 billion monthly loss of real income. Separately, the BEA release of 6 March 2019 reported that the annual goods-and-services trade deficit rose from US$552.3 billion in 2017 to US$621.0 billion in 2018, an increase of US$68.7 billion. The release date should not be confused with the period measured, and the deficit change alone does not isolate the effect of tariffs.
In its January 2020 outlook, the Congressional Budget Office projected that the tariffs would reduce the level of real GDP by roughly 0.5% and raise consumer prices by 0.5% in 2020, relative to the comparison without those tariffs. These were model projections, not observed outcomes or a 0.5-percentage-point fall in the GDP growth rate.
2) Expenditure reducing policies
Expenditure reducing policies aim at lowering the aggregate demand and lowering the level of national income and decreasing imports. Governments may reduce AD by implementing a contractionary fiscal and monetary policy. A lower AD will lower the pressure of inflation and export sectors may benefit from lower prices compared with its trading partners. Lower imports and higher exports improve the CAD. However, the degree of contractionary demand-side policies has to be carefully examined to avoid an over contraction of the economy that can cause serious unemployment.
3) Supply-side policies
Supply-side policies aim to increase the competitiveness of the import and export-competing sectors. Governments may implement policies like improving market efficiency and labour productivity so that production costs are lowered. Exports become more attractive while imports become less attractive; this improves the CAD. However, the implementation of supply-side policies take a long time and can be costly to implement. It may also worsen income inequality when the market efficiency is improved.
4) Exchange rate policies
Exchange rate policies aim to lower the price of exports by devaluating the domestic currency. When the domestic currency is devaluated, the price of exports is lowered and the quantity transacted is higher. At the same time, the price of imports increases and the quantity transacted is lowered. Given that the Marshall-Lerner condition is satisfied, a devaluation of the domestic currency will improve the CAD. The Marshall-Lerner condition is discussed in detail below.
In 2019, the yuan depreciated beyond 7 yuan per US dollar for the first time in over a decade. This came a few days after President Trump said that he would impose a 10% tariff on $300 billion worth of Chinese goods. It had the impact of making Chinese exports more competitive, as they became cheaper to buy with foreign currencies.
The People’s Bank of China also devalued the exchange rate against the dollar in 2015. This was one of several monetary policy tools that the People’s Bank of China employed in 2015 as part of its market-oriented reforms to deal with a slower rate of growth.
The Marshall-Lerner condition and the J-curve effect
The Marshall-Lerner condition
Depreciation or devaluation does not automatically improve the current account. It changes relative prices, but the effect on export receipts and import expenditure depends on demand elasticities, the currency in which values are measured, price pass-through and adjustment lags. The Marshall–Lerner condition below explains when depreciation improves the trade balance under the model’s assumptions; the J-curve explains why the short-run outcome may differ.
The Marshall-Lerner condition states that for a currency devaluation or depreciation to improve the CAD, the sum of the PED for exports and the PED for imports (the absolute value) must be greater than one.
1) PED (X) + PED (M) > 1, devaluation/depreciation of domestic currency helps improve the CAD.
2) PED (X) + PED (M) = 1, devaluation/depreciation of domestic currency causes no change in the CAD.
3) PED (X) + PED (M) < 1, devaluation/depreciation of domestic currency deteriorates the CAD.
The J-curve effect
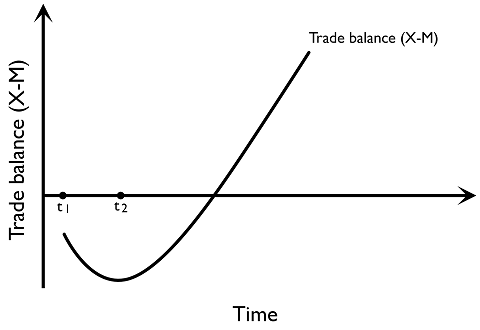
The J-curve effect states that if the PED for exports and the PED for imports are low in the short run, the Marshall Lerner condition is not satisfied. A depreciation or devaluation in the currency may not help improve the CAD in the short run.
Figure 4.6.3 shows that a trade deficit exists in the country in time \(t_1\). In the short run, the PED for exports and imports is low, as consumers need time to realise the change in the exchange rate and prices. In addition, the exporting and importing retailers usually make contracts with the manufacturing firms where the exchange rate is kept constant within the contract period to avoid risk from fluctuating exchange rates. Thus, retailers will not lower the prices immediately after the depreciation of the exchange rate. The deficit in the short run becomes bigger since the Marshall Lerner condition is not satisfied. After time \(t_2\), the PED for exports and imports increases and the Marshall Lerner condition is satisfied. The trade deficit becomes smaller and gradually the trade balance can be improved.
Implications of a persistent current account surplus
1) Lower domestic consumption and investment
A current account surplus is a positive combined balance of trade in goods and services, primary income and current transfers. It may reflect strong export competitiveness or domestic saving exceeding investment. Weak domestic demand can also contribute to a surplus, but a surplus alone does not establish low consumption, low income or a low standard of living. Its causes must be assessed.
2) Pressure for appreciation of the domestic currency and lower export competitiveness
A persistent current account surplus may put pressure on the domestic currency to appreciate, as the demand for the domestic currency is higher than the supply. The appreciation may lower the export competitiveness and export sectors may suffer. However, the appreciation may force the exporting industries to be more efficient to maintain competitiveness in the international market.
3) Inflation and employment
A current account surplus means that net exports (X - M) are increasing, shifting AD to the right. This might increase inflation and employment.