3.1 Measuring economic activity and illustrating its variations
Gross Domestic Product (GDP) is the total market value of all final goods and services produced in an economy in a given period of time, usually one year. It is written as a sum of its constituent components: C + I + G + (X – M).
National income accounting measures the economy’s value of output. There are 3 approaches to measuring an economy’s output:
- Expenditure Approach
- Income Approach
- Output Approach
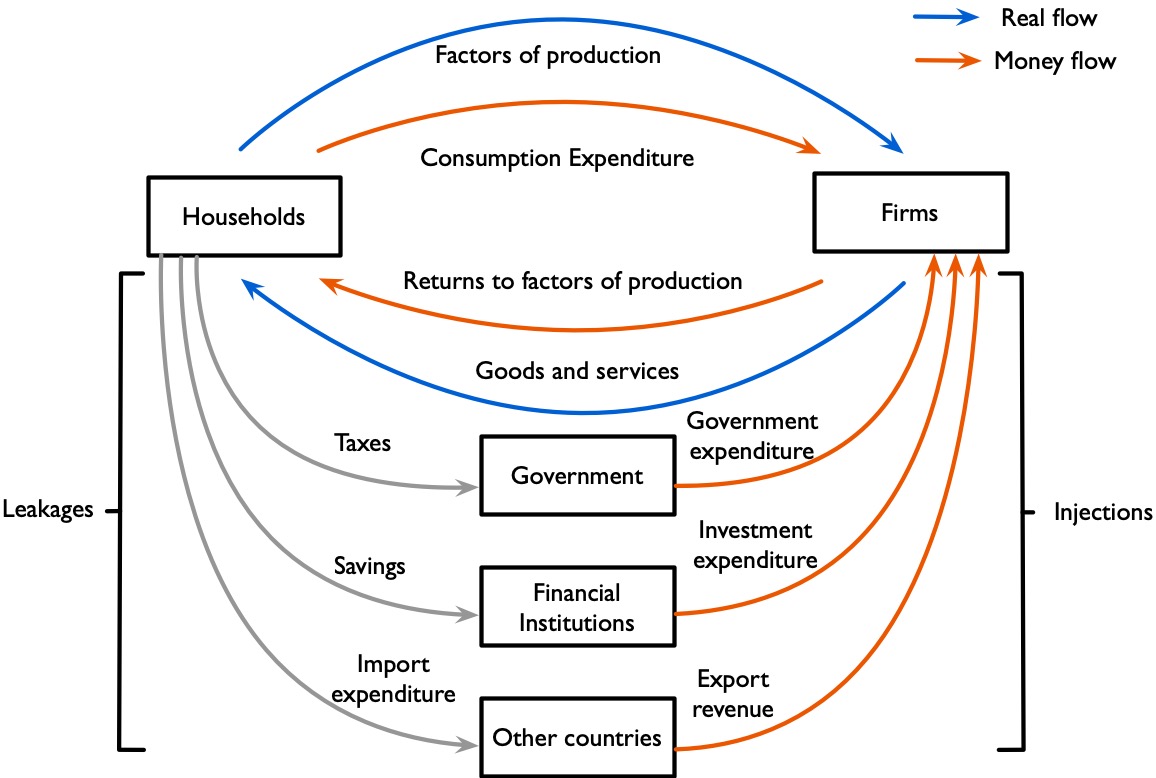
Throughout, it will be useful to return to the circular flow of income model (Figure 3.1.1).
The Expenditure Approach
In the expenditure approach, we add all expenditures spent on final goods and services that are produced domestically. This includes summing up: consumption expenditure (C), investment expenditure (I), government expenditure (G), and net export revenue (X-M).
Expenditure Approach = C + I + G + (X – M)
The word “net” refers to the difference between the total values of exports and imports. Note that the value of net exports (X – M) can be negative when the value of imports exceeds those of exports.
The Income approach
Income approach measures all the factor income earned by the four different factors of production that produce all goods and services within a country over a given time period.
Income Approach = Rents + Interests +Wages + Profits
That is, it measures the value of the arrow marked ‘Factors of production’ in Figure 3.1.1.
The Output approach
The output approach measures the value of all final goods and services produced in the economy in a given period of time. Note that final goods and services refer to those made for final consumption, and does not include the value of intermediate goods (goods that are not made for final consumption); otherwise, there will be double counting. Consider an example where a miller produces $5 worth of flour, which is then made into bread worth $10 by a baker. Adding up both the values of flour and bread results in double counting the value of flour, as it is already contained in the value of bread.
Output approach = value of final good1 + value of final good2 + … + value of final goodn
That is, it measures the value of the arrow marked ‘Goods and services’ in Figure 3.1.1.
Equivalence of the approaches
Although each approach measures the value of a country’s output differently by looking at different sets of data, they are measuring the same thing, so they are necessarily an equal amount.
National output = National income = National expenditure
However, in practice, the data collected to calculate each of these values comes from different sources, leading to inaccuracies in the data and imbalances between the final values.
Nominal GDP as a measure of national output
In real life, the economy usually measures GDP using the expenditure approach. Let us consider the following example:
Simplified exercise using the figures supplied for the UK, 2019 Q4: calculate GDP using the expenditure approach. For this exercise, assume that the investment figure covers all the investment required in the identity, and that government expenditure is final expenditure rather than transfer payments.
| £ million | |
|---|---|
| Consumer expenditure on goods and services | 330,126 |
| Government expenditure | 100,767 |
| Investment (assumed total for this exercise) | 86,917 |
| Exports | 169,759 |
| Imports | 163,130 |
Historical context: UK, 2019 Q4. The original exercise attributed its inputs to the Office for National Statistics. Business investment alone is not total gross capital formation; these supplied figures are therefore retained as a simplified exercise, not a verified official GDP estimate.
GDP = C + I + G + (X - M)
GDP = 330,126 + 86,917 + 100,767 + (169,759 - 163,130)
GDP = 517,810 + 6,629 = £524,439 million
Nominal GNI as a measure of national output
Gross national income (GNI) is the total primary income received by residents of an economy. GDP measures production within the economy’s territory, whereas GNI adjusts GDP for primary income received from and paid abroad. Residence, rather than nationality, is the relevant distinction.
GNI = GDP + net primary income from abroad
Net primary income from abroad is primary income received by residents from non-residents minus primary income paid to non-residents. It includes compensation of employees and property income, such as interest, dividends and reinvested earnings.
Simplified exercise using the figures supplied for France, 2019: calculate GNI assuming that net compensation of employees and any other primary-income flows not shown are zero.
| $ millions | |
|---|---|
| GDP (France, 2019) | 2,659,119 |
| Net property income from abroad
(France, 2019) |
39,806 |
GNI = GDP + net primary income from abroad. Under the stated assumption, net primary income equals net property income: GNI = 2,659,119 + 39,806 = $2,698,925 million. Without that assumption, the two supplied figures are insufficient to calculate GNI.
Real GDP and GNI
Nominal GDP is GDP not adjusted for inflation and is measured by current prices, which are the prevailing prices at the time of measurement. However, prices change over time. If there was a 10% increase in nominal GDP, we cannot comprehend whether the increase in nominal GDP is brought upon by an increase in output or price level. To allow meaningful comparisons over time, GDP has to be measured in real terms as Real GDP, where GDP is adjusted for inflation so the price level of goods and services are held at a constant level.
Calculation of nominal and real GDP
GDP deflator measures the level of prices of all final goods and services produced in an economy.
\(\text{GDP deflator} = \dfrac{\text{Nominal GDP}}{\text{Real GDP}} \times 100\). Real GDP must use the stated base-year prices. A simple current-price/base-year-price ratio gives the same result in a one-product illustration, but is not the general formula for a multi-product economy.
Consider the following example, suppose country A only produces good X and the table below shows the price and output level in 2012 and 2013.
| 2012 (base year) | 2013 | |||
|---|---|---|---|---|
| Price | Output | Price | Output | |
| Good X | $20 | 8,000 | $25 | 10,000 |
i) How can we calculate the nominal GDP in 2013?
The nominal GDP in 2013 = Price (2013) x Quantity (2013) = $25 x 10,000 = $250,000
ii) How can we calculate the real GDP in 2013 (using the price in base year)?
The real GDP in 2013 = Price (2012) x Quantity (2013) =$20 x 10,000 = $200,000
iii) How can we calculate the GDP deflator from 2012 to 2013?
\( GDP \; deflator = \frac{New \; price}{Base \; Year \; price} \) x 100
\( GDP \; deflator \; (2013) = \frac{$25}{$20} \times 100 = 125 \)
iv) How can we calculate the real GDP in 2013 (using GDP deflator)?
\( Real \; GDP \; (2013) = \frac{$250,000}{125} \times 100 = $200,000 \)
We can see that it gives the same result as in ii).
Real GDP and real GNI per capita at purchasing power parity
Total GDP is useful for comparing the sizes of different economies, but it might be a poor indicator of the comparison of living standards due to differing populations. Even when comparing the living standards of the same economy over time, changes in population need to be taken into account. We therefore use per capita GDP, which is calculated by dividing the total GDP by the total population, to give the average economic activity per person.
\( GDP \; per \; capita = \dfrac{Total \; GDP}{Total \; population} \)
For example, China’s GDP in 2018 was around US$13.61 trillion. This is a lot higher than France’s 2018 GDP, which was around US$2.78 trillion. However, China’s population in 2018 was around 1.39 billion whereas France’s was around 66.89 million. China’s GDP per capita was therefore around US$9,791, whereas France’s was around US$41,560, which is significantly higher.
We may also want to measure real GDP and real GNI with purchasing power parity (PPP). Purchasing power parity is the exchange rate necessary for some amount of money, for example £100, to buy the same amount of products in each country. For example, if the real GDP per capita is $2,000 in country A, and $4,000 in country B, while the cost of living in country B is twice that in country A, then real GDP per capita at PPP would be equal between the countries. We might want to calculate real GDP and GNI at PPP in order to allow a realistic comparison of the standards of living between countries.
The Big Mac Index was introduced by The Economist in 1986 as a way of measuring the purchasing power parity between two currencies. It tests the idea that in the long run exchange rates should move towards the rate that equalises prices in different countries by looking at one good, the McDonald’s Big Mac burger. The Big Mac was chosen on the grounds that it is available in most countries around the world.
The Big Mac PPP exchange rate is obtained by dividing the price of a Big Mac in one country, in its domestic currency, by the price of a Big Mac in the other country, in that country’s domestic currency. If this value is lower than the actual exchange rate, the first currency is under-valued, and vice versa.
For example, the July 2019 Big Mac Index suggested that the British pound was 29% undervalued against the US dollar. A Big Mac cost £3.29 in Britain and $5.74 in the United States, implying an exchange rate of 0.57; however, the actual exchange rate was 0.80.
You can look at the current Big Mac Index by accessing the following link: https://www.economist.com/news/2020/01/15/the-big-mac-index
Business cycle: short-term fluctuations and long-term growth trend
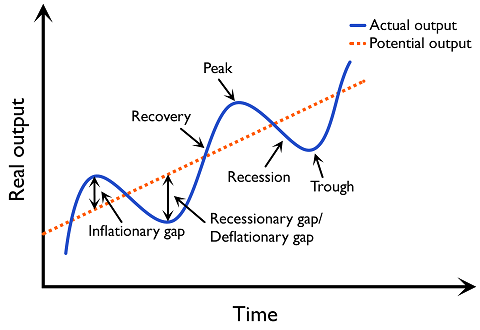
The business cycle is the periodic fluctuations in actual GDP around the potential GDP. There are 4 stages in a business cycle, including recovery, peak, recession and trough.
Figure 3.1.2 shows the business cycle. The long-term growth is called the potential output of an economy. It is a level of real GDP in which the unemployment rate will be equal to the natural rate of unemployment. Actual output refers to the actual real GDP that is produced in the economy. When the actual real GDP exceeds the potential real GDP, the economy is said to have an inflationary gap. When actual real GDP is below potential real GDP, the economy is said to have a recessionary gap/deflationary gap.
Decrease in GDP versus a decrease in GDP growth
When there is a decrease in GDP, the change in GDP is negative. An example would be when the GDP decreases from 10 billion to 9 billion in an economy. This occurs during periods of recession.
When there is a decrease in GDP growth, the change in GDP is still positive, except that the growth is taking place at a slower rate. For example, when the GDP growth rate of an economy drops from 8% to 5%, the actual GDP figure would have increased from 10 billion to 10.5 billion, even though the 5% increase in GDP is less than the previous period of 8% increase. This occurs when the economy is expanding and approaching its peak level.
Appropriateness of using GDP or GNI statistics to measure economic well-being
Merits
(1) GDP has a high correlation with other quality of life indicators
GDP has a high correlation with living standards. The provision and availability of factors that contribute towards a high living standard, such as good health care and safe drinking water, tends to correlate with GDP.
(2) GDP data is widely available, is measured frequently, and is consistent
Almost all economies gather GDP data, making it the measure of choice for comparing living standards between countries. It is also gathered frequently, which makes it possible to see any changes quickly. The definition of GDP is also consistent across countries, which allows it to be used for cross-country comparisons.
Demerits
(1) Under-recording and excluded non-market services
Subsistence production of goods and production in the informal economy fall within the GDP production boundary, but may be difficult to measure and under-recorded. Most unpaid household services are excluded. For instance, household services provided by maids are included in the calculation of GDP, but those provided by housewives are not, because the latter is not bought on a market. Under-recording of production and the exclusion of unpaid services limit GDP as a measure of living standards.
(2) Quality improvement of goods and services over time
GDP measures the market value of goods and services and therefore ignores quality changes of the goods over time. For instance, a hard drive that costs $100 today has a much larger storage than a hard drive of the same price five years ago. Therefore, when making comparisons over time, the quality of production and living tends to be underestimated.
(3) Composition of GDP
Economies put emphasis on different sectors, and GDP might be a poor indicator of a country’s living standards. For instance, when there is a heavy bias in the production of capital goods, the production possibilities frontier is shifted outwards, but present living standards are lowered. This is especially a problem when comparing economies with vastly different ways of organising production.
(4) Per capita GDP ignores inequality
GDP per capita is a measure of averages, which would overestimate the living standards of the majority of the population if there are serious imbalances in the distribution of income. Hong Kong’s GDP per capita figures, for instance, overestimate the general living standard, as it ranks among economies with the worst inequalities in income distribution.
(5) Inaccuracies
Data used to calculate the measures of national income come from a variety of sources. This means that the initial assessments of national income tend to be slightly inaccurate, and figures tend to become more accurate over time when they are revised.
(6) External costs
GDP does not take into account external costs such as resource depletion and the negative consequences of pollution.
(7) Other quality of life concerns
GDP might grow because people work longer hours, or even because the country is at war! Such increases in GDP do not reflect an increase in standards of living.
Alternative measures of well-being
The OECD Better Life Index
The OECD (Organisation for Economic Cooperation and Development) promotes policies that will improve economic and social well-being throughout the world.
The Better Life Index compares well-being across countries based on eleven topics that reflect what the OECD has identified as essential to well-being in terms of material living conditions (housing, income, jobs) and quality of life (community, education, environment, civic engagement, health, life satisfaction, safety, and work-life balance).
The Happiness Index
The Happiness Index is a composite index put together by the United Nations Sustainable Development Solutions Network. It ranks countries by their happiness levels using data from the Gallup World Poll and other sources like the World Values Survey. It considers variables like GDP per capita, social support, life expectancy, the freedom to make choices, generosity, and perceptions of corruption.
According to the Happiness Index, the happiest country in the world in 2019 was Finland, and the least happy was South Sudan.
The Happy Planet Index
The Happy Planet Index measures sustainable well-being; that is, it looks at how well countries are achieving long and happy lives, taking into account sustainability.
\( Happy\;Planet\;Index = \dfrac{Wellbeing\;\times\;Life Expectancy\;\times\;Inequality\;of\;Outcomes}{Ecological\;Footprint} \)
Wellbeing is how satisfied the residents of each country say they feel with life, on a scale from 0-10.
Life expectancy is the average number of years a person is expected to live, based on UN data.
Inequality of outcomes is inequality based on life expectancy and happiness, based on the distribution of each country’s life expectancy and wellbeing data.
Ecological footprint is the average impact that each resident has on the environment, based on the data provided by the Global Footprint Network.