Income and wealth inequality require different measures and explanations.
Must know
- The Lorenz curve shows cumulative shares.
- The Gini coefficient summarises inequality.
- Taxes assets education and labour-market conditions affect distribution.
Must know definitions
Wealth inequality: unequal holdings of wealth across a population; specify whether the data measure gross assets or net wealth after liabilities.
Income inequality: the unequal distribution of income flows (wages, dividends, rent) across a population.
Lorenz curve: a graph plotting the cumulative share of income or wealth against the cumulative share of the population, used to visualise inequality.
Gini coefficient: a single numerical measure of inequality derived from the Lorenz curve, ranging from 0 (perfect equality) to 1 (perfect inequality).
Kuznets hypothesis: the theory that inequality rises then falls as an economy develops from agricultural to industrial to service-based.
Must know relationship: Gini coefficient = A / (A + B).
Interpretation: A is the area between equality and the Lorenz curve; A + B is the area under equality. Gini has no unit, from 0 to 1, or 0 to 100 when explicitly expressed on that scale. Compare the same income or wealth measure.
Explain and apply
Mechanism in brief: Progressive taxes and transfers can reduce disposable-income differences. Their distributional effect depends on coverage, take-up and behavioural responses, while public services can affect opportunities beyond measured cash income.
Distinguish: Income is a flow and wealth a stock; a single Gini number does not show where inequality occurs.
Use the extract: Check whether data concern income or wealth, before or after tax, and which groups gain.
The distinction between wealth inequality and income inequality
- Wealth is a stock concept — the total value of assets a person or household owns at a point in time, such as property, shares, savings and land.
- Income is a flow concept — money received over a period, such as wages, dividends, rent and interest.
- Wealth inequality is the unequal distribution of asset ownership across a population, while income inequality is the unequal distribution of income flows.
- Wealth inequality is typically far more pronounced than income inequality, since accumulated wealth compounds over time (e.g. through inheritance and investment returns) while income is repeatedly earned and redistributed each period.
Measurements of inequality
- The Lorenz curve plots the cumulative share of income (or wealth) against the cumulative share of the population, ranked from poorest to richest.
- A 45° diagonal line represents perfect equality (the poorest x% of the population always holds exactly x% of income); the further the actual Lorenz curve bows below this line, the greater the inequality.
Figure 4.9 Lorenz curve and Gini coefficient
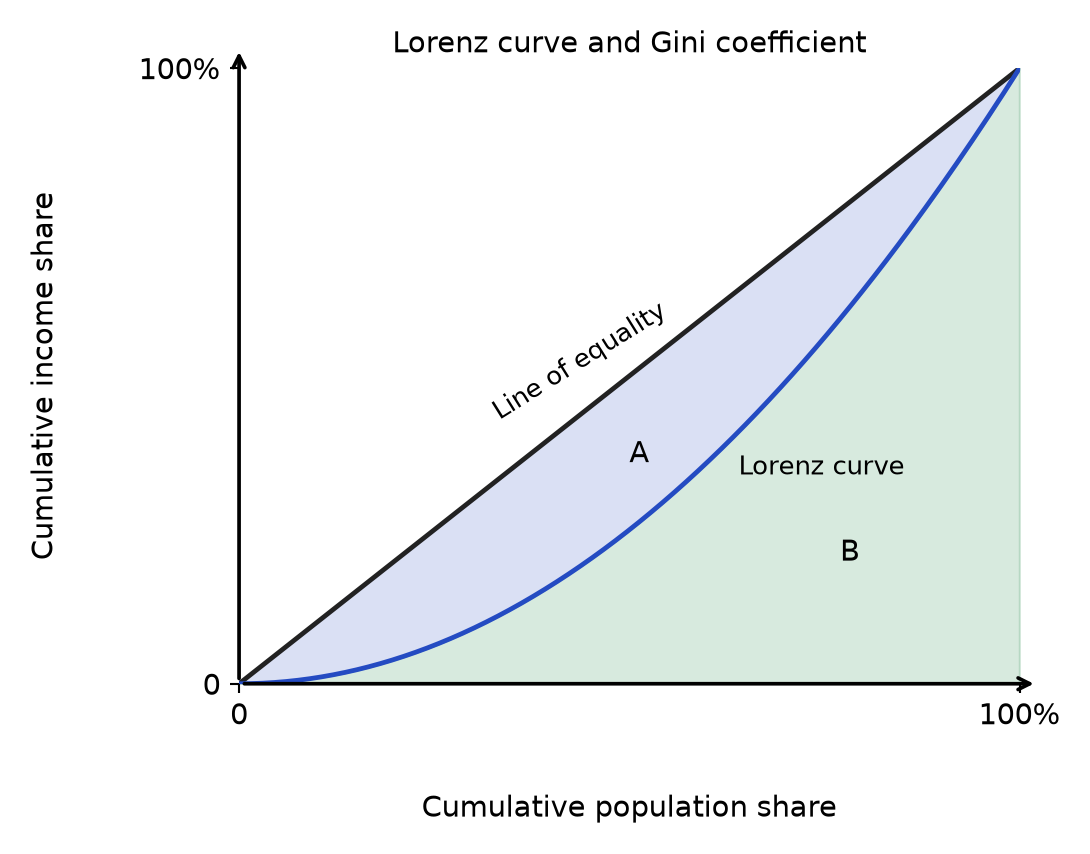
Read the diagram: Rank people from poorest to richest → read cumulative population and income shares → compare the Lorenz curve with equality → calculate Gini = A / (A + B). Greater bowing indicates more inequality; the same Gini can conceal different distributions.
- The Gini coefficient converts the Lorenz curve into a single number: Gini = A / (A + B), where A is the area between the line of equality and the Lorenz curve, and B is the area under the Lorenz curve.
- The Gini coefficient ranges from 0 (perfect equality) to 1 (perfect inequality, where one person holds all income or wealth) — the larger the coefficient, the greater the inequality.
Causes of inequality in income and wealth within countries and between countries
Within countries:
- Wage inequality — a widening gap between skilled and unskilled workers' pay (graduates earn more over their lifetime than those without a degree), the growth of part-time and temporary contracts leaving some workers underemployed, and persistent gender or other pay gaps despite equal pay legislation.
- Unemployment — households with no one in work rely on state benefits, which are typically well below average wages, widening the income gap and pushing such households toward relative poverty.
- Welfare and tax structure — benefits that rise more slowly than wages (even if index-linked to inflation) leave recipients falling behind in relative terms; a tax system that has shifted toward regressive indirect taxes, or cut top marginal income tax rates, tends to raise post-tax inequality since the gains flow disproportionately to higher earners.
- Ownership of assets — wealth is more unevenly distributed than income to begin with, so those already holding property, shares or savings can accumulate further wealth through capital gains and dividends, compounding inequality over time.
Between countries:
- Historical and structural factors — the Industrial Revolution began in Britain and spread through Western Europe, but colonial exploitation and unequal terms of exchange widened the income gap between colonising and colonised nations, a legacy still visible in global income differences today.
- Wars, conflict, and natural disasters — these destroy capital and displace populations, holding back the affected country's growth relative to others.
- Discrimination and exclusion — inequality of opportunity based on where a person is born can produce very different life outcomes even for people with similar ability, as reflected in large gaps in life expectancy and income between high- and low-income countries.
- Convergence — faster growth in developing economies relative to developed ones can narrow the gap between rich and poor countries over time, though progress is uneven across regions.
The impact of inequality
| Area | Impact of high inequality |
|---|---|
| Enterprise | can incentivise risk-taking and entrepreneurship (higher potential reward), but excessive inequality may instead entrench existing wealth and reduce opportunities for new entrants |
| Incentives | higher potential rewards for effort and skill can encourage work and investment, but very unequal outcomes can also discourage effort among those who see little chance of advancement |
| Savings | higher-income households save a larger share of income, so rising inequality can raise the aggregate savings rate, though lower-income households may be pushed towards high-cost borrowing |
| Education | children from lower-income households often have less access to quality education, reducing social mobility and perpetuating inequality across generations |
| Migration | large income gaps between regions or countries can drive migration in search of higher wages, which can ease inequality for migrants but create brain drain in the country of origin |
| Life expectancy | inequality is associated with unequal access to healthcare, nutrition, and living conditions, contributing to significant gaps in life expectancy both within and between countries |
The impact of economic change and development on inequality
- The Kuznets hypothesis (based on Simon Kuznets's study of US, UK and German data) models inequality as an inverted-U shape plotting inequality against income per capita or stage of development:
Early development
labour shifts from low-productivity agriculture into higher-productivity, higher-wage industry; since only some workers move at first, a wage gap opens up between the modernising industrial sector and the still-largely-agricultural rest of the economy → inequality ↑.
Later development
more of the workforce is absorbed into industry and then services, and the government's tax base widens → more revenue available for redistribution through benefits, pensions and public education → inequality ↓.
Prediction
inequality is worst for middle-income, industrialising economies, and lower for both low-income agrarian economies and high-income mature economies.
Figure 4.10 Kuznets hypothesis
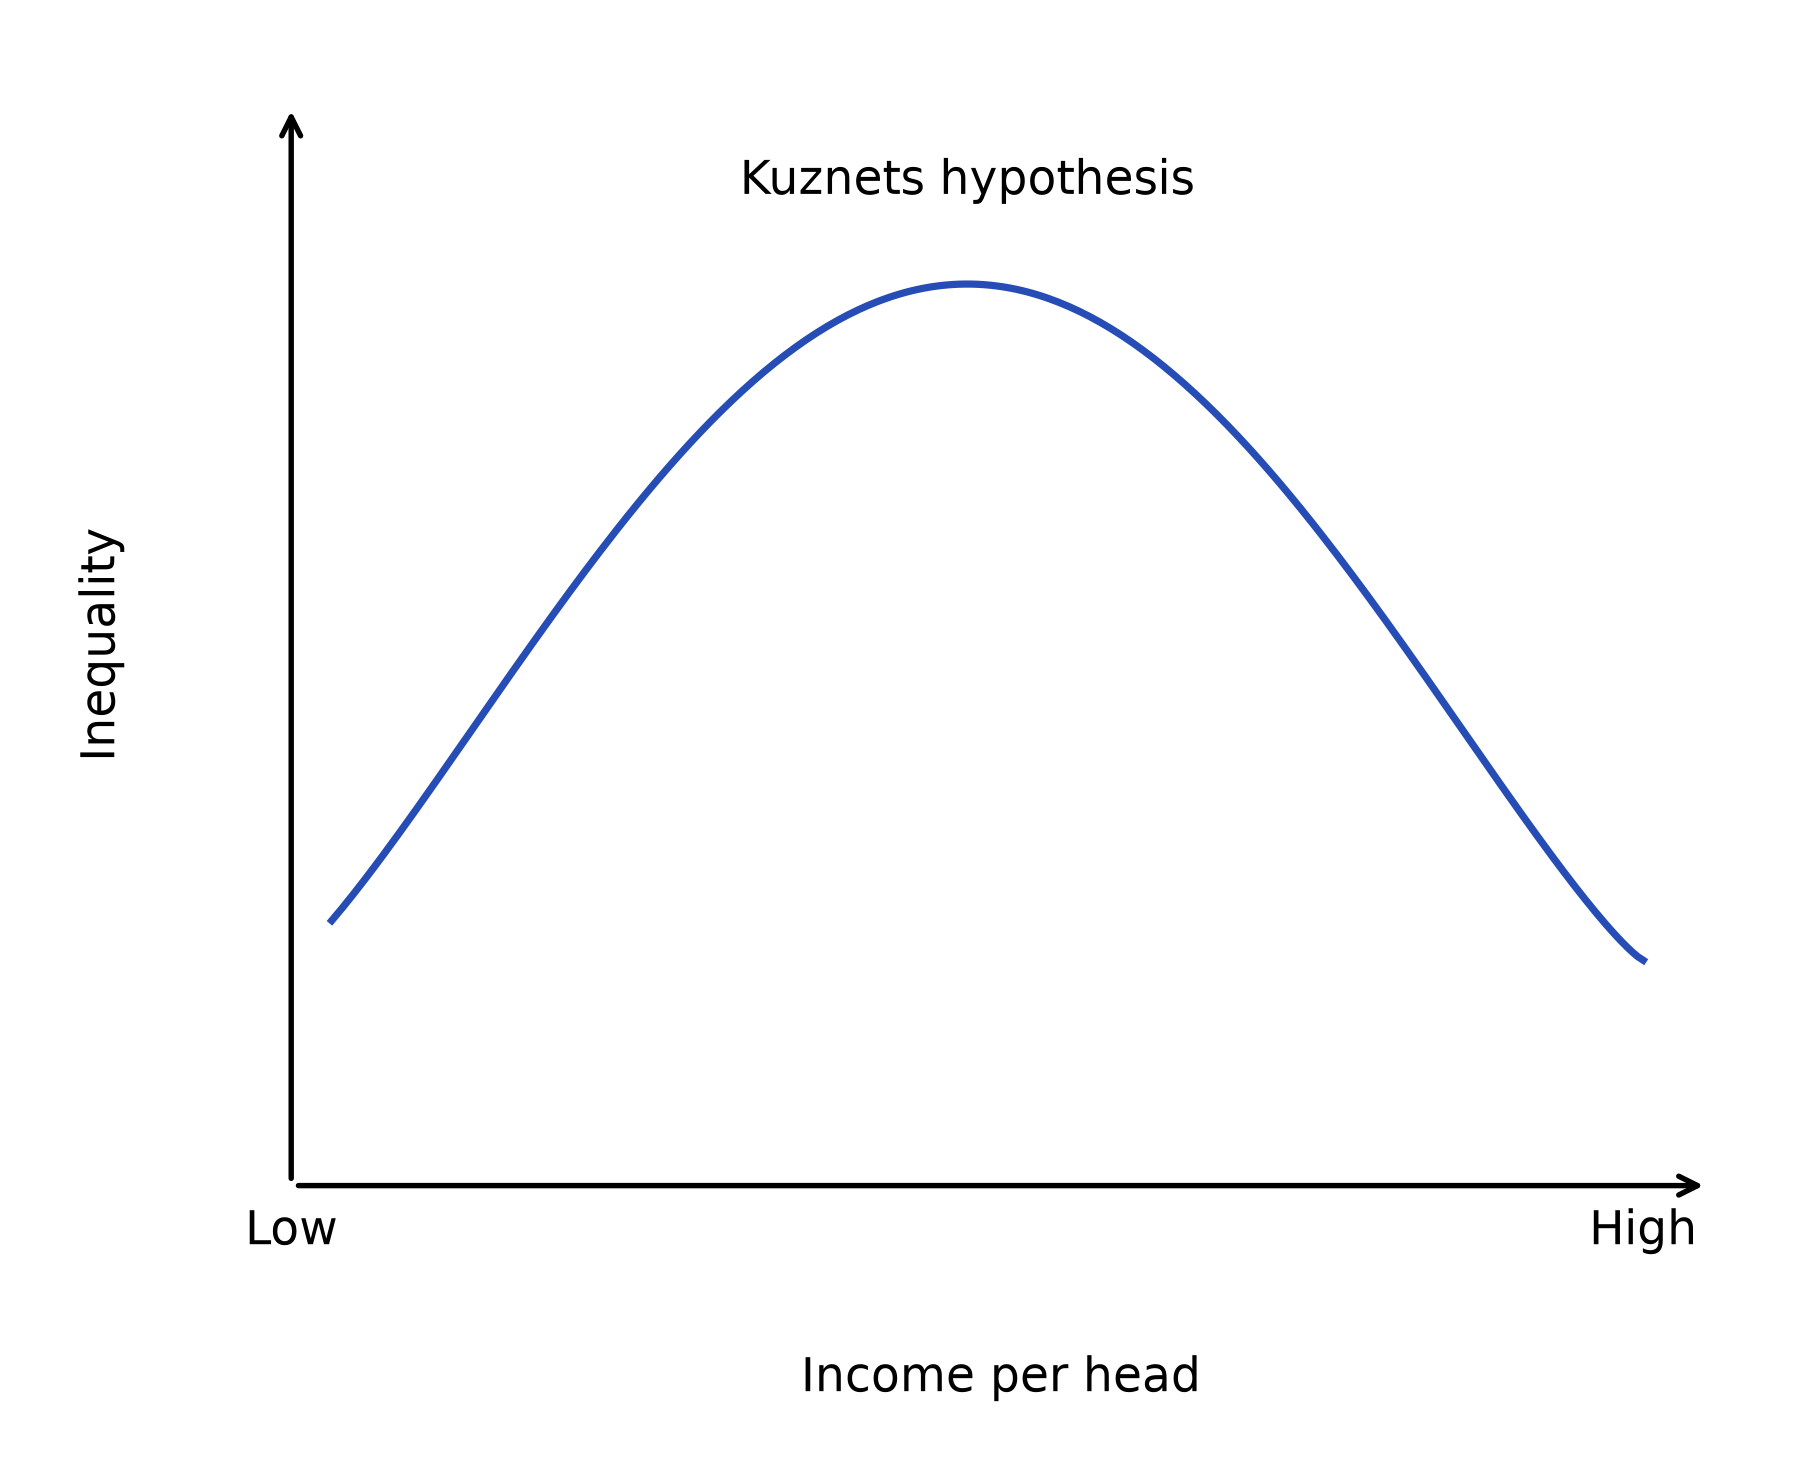
Read the diagram: The curve illustrates a hypothesis that inequality first rises and later falls during development. It does not imply zero inequality at either end. Institutions, education, taxation and the pattern of growth can produce different paths.
The hypothesis is a generalisation, not a guaranteed law, and its empirical support is weak:
Small, dated sample
the original curve was based on a small, historically specific sample (mainly Western economies over a limited period) — critics argue any apparent U-shape reflects differences between countries at one point in time rather than a genuine path any single country follows as it develops.
East Asian counter-example
economies such as Taiwan and South Korea industrialised rapidly from the 1960s onward while inequality stayed relatively low or even fell — the opposite of what the curve predicts.
"Wave" pattern, not a single hump
inequality has risen again in most developed economies since the 1980s, so real-world data often shows repeated ups and downs rather than one rise-then-fall; many economists reviewing decades of cross-country data conclude the hypothesis does not hold as a general law.
Piketty's critique
Thomas Piketty challenges the view that inequality necessarily falls as economies develop, emphasising the historical effects of wars, depression and policy on wealth. When the rate of return on capital (r) exceeds the growth rate of national income (g), existing wealth may accumulate faster than national income if enough of the returns are reinvested. This does not mean capital owners’ incomes automatically grow at rate r: saving, taxation, changing returns and the distribution of ownership affect the outcome.
On this view, historical shocks and deliberate policy (progressive taxation, wealth taxes) can reduce wealth concentration. Inequality does not necessarily fall automatically with development; the outcome also depends on saving behaviour and the distribution of capital ownership.
The significance of the free market economy (capitalism) for inequality
- Capitalism is an economic system based on private ownership of capital, profit motive, and resource allocation through free markets rather than the state.
Why capitalism tends to generate inequality
wages are bid up for workers with scarce or highly productive skills while remaining low for those in abundant supply; private ownership of capital lets asset-holders earn profit, rent, dividends and capital gains on top of any wage income, so income from wealth compounds on top of income from work. Access to capital and to high-return education/training is itself unequally distributed, so this tends to be self-reinforcing across generations through inheritance.
The case for capitalism (incentives)
unequal reward for effort, risk-taking and innovation is what motivates entrepreneurship and investment in the first place.
The case for capitalism (absolute living standards)
defenders point to capitalism's long-run record of lifting billions out of absolute poverty through sustained growth — a smaller share of a much bigger pie can still mean a higher absolute living standard for the poor.
Trickle-down argument
if the wealthy and firms are taxed lightly and free to invest, the resulting growth, jobs and wages will filter down through the economy to workers and consumers.
| Argument for capitalism/inequality | Counter-argument |
|---|---|
| Rewards risk-taking, effort and skill → incentivises enterprise and innovation | Rewards can reflect inherited wealth or luck of birth as much as effort → inequality of outcome without genuine equality of opportunity |
| Growth under capitalism has historically reduced absolute poverty even as relative inequality rose | Hope and Limberg (2022), studying major tax reductions for the rich in 18 OECD countries during 1965–2015, found higher income inequality and no statistically significant average effect on economic growth or unemployment over the horizons examined. This challenges the claimed growth benefits of those reforms; it does not prove that every tax cut has zero effect. |
| Private property rights and profit motive drive efficient allocation of resources | Firms may under-provide goods with positive externalities (e.g. healthcare, education) and ignore negative externalities (e.g. pollution), harming welfare beyond the inequality question |
| Diminishing marginal utility argument is sometimes dismissed as anti-enterprise | The same logic implies a given sum of money raises welfare far more in the hands of a low-income household than an already-wealthy one, weakening the efficiency case for very high inequality |
Piketty's r > g critique
often used as a counter-argument to the pro-capitalism case — if returns to capital persistently exceed economic growth, wealth may become more concentrated where ownership is unequal and gains are saved. The outcome depends on saving, taxation and changes in ownership; r > g alone does not establish indefinite concentration.
Implication
redistribution has to be a deliberate policy choice (progressive income and wealth taxes, inheritance tax, strong welfare states) rather than something capitalism delivers automatically — which is why most real-world capitalist economies are mixed economies, where the state intervenes through taxation and welfare spending to offset the inequality an unmodified free market would otherwise produce.
Balance the equity gain against funding and incentive effects using evidence. A lower Gini does not establish that the poorest are better off if average income falls, so examine levels as well as distribution.
Rapid recap
Income is a flow; wealth is a stock. A Lorenz curve shows cumulative shares; Gini = A/(A+B). One coefficient does not reveal which groups gained or lost.
Diagram cue: label the Lorenz curve and equality line and interpret the Gini areas.
Related chapters: Unit 4 chapter 9 (p. 45) · Unit 4 chapter 12 (p. 56)
Why this connects: Taxation and public services can change distribution, while poverty measures ask whether people have adequate resources. A lower Gini does not settle the poverty question.